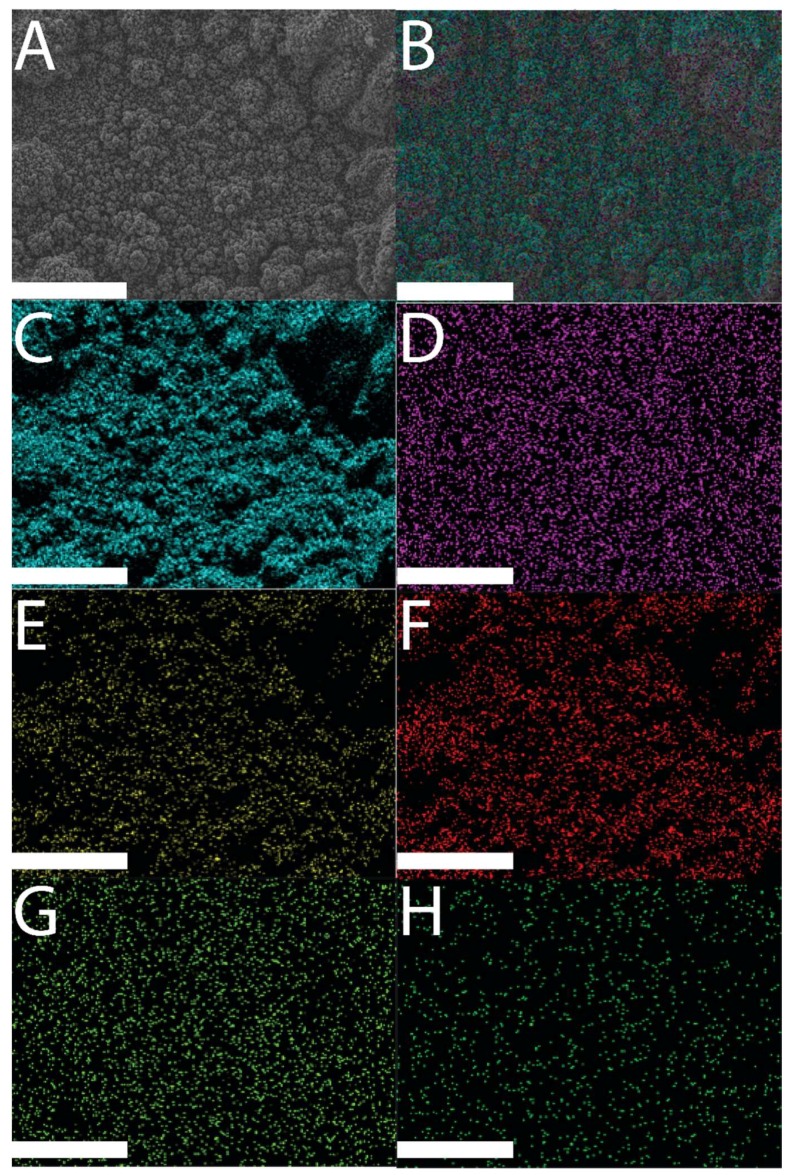
Figure 3.
SEM and EDX images of an MER-doped PPY film: (A) SEM image of an MER-doped PPY film; (B) EDX layered image from an MER-doped PPY film; (C) Kα emission of C; (D) Kα emission of P; (E) Kα emission of F; (F) Kα emission of O; (G) Kα emission of N; (H) Kα emission of Si. Scale bars represent 100 µm.

