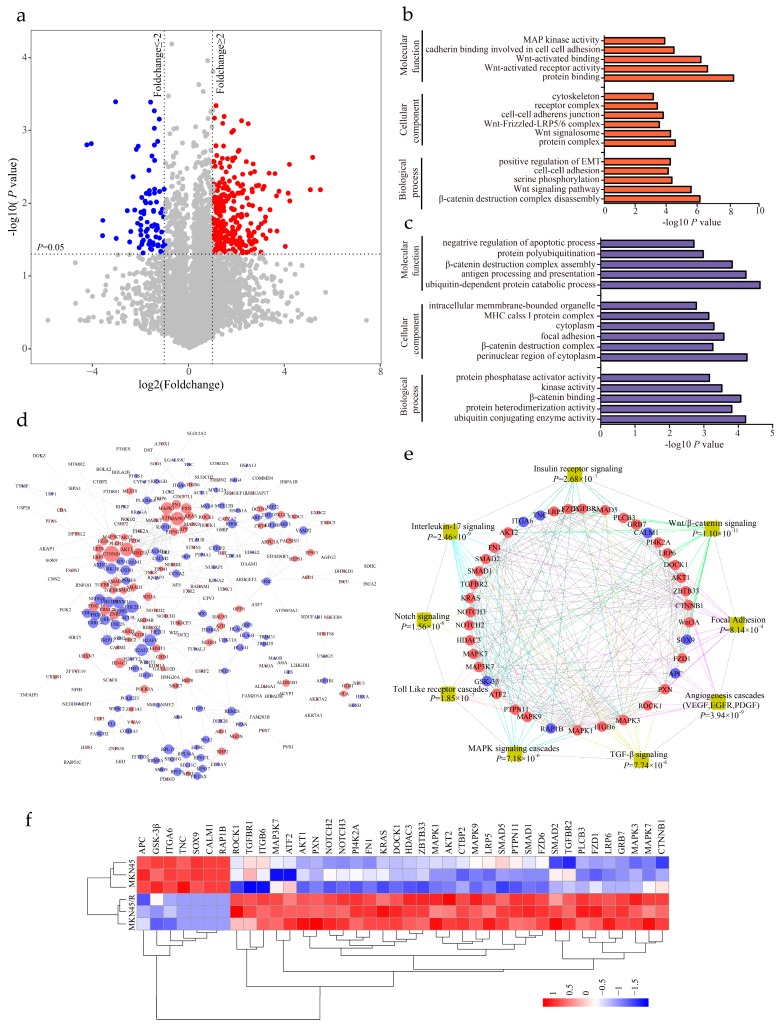
Figure 3.
Bioinformatics analysis of differentially expressed proteins and significantly altered pathways. (a) Differentially expressed proteins in MKN45 and MKN45/R cells are illustrated by volcano plot. The mean ratios of three biological repeats (MKN45/R group/MKN45 group) are plotted in log2 scale (x-axis) against the corresponding −log10 p value (y-axis). The vertical dotted lines mark twofold change and horizontal dotted lines represent cutoff p value = 0.05. Proteins which showed fold changes greater than 2 or less than 0.5 and p < 0.05 are considered as up- or down-regulated and marked in red and blue, respectively. The gray dots are considered as no significant change; (b,c) Gene ontology (GO) enrichment analysis of upregulated (red bar) and downregulated proteins (blue bar) involved in cell component, molecular function and biological process; (d) Network analysis of differentially expressed proteins performed by Cytoscape. Red and blue nodes represent increased and decreased proteins respectively. Sizes of nodes correspond to numbers of interacting neighbors; (e) WebGestalt analysis identified major biological pathways in which differential proteins are involved. Each colored line indicates a different pathway; (f) Heat map visualization of forty differential proteins identified from several pathways in both MKN45 and MKN45/R cells. The increased and decreased proteins are represented by range of red and blue intensities, respectively.

