Figure 4.
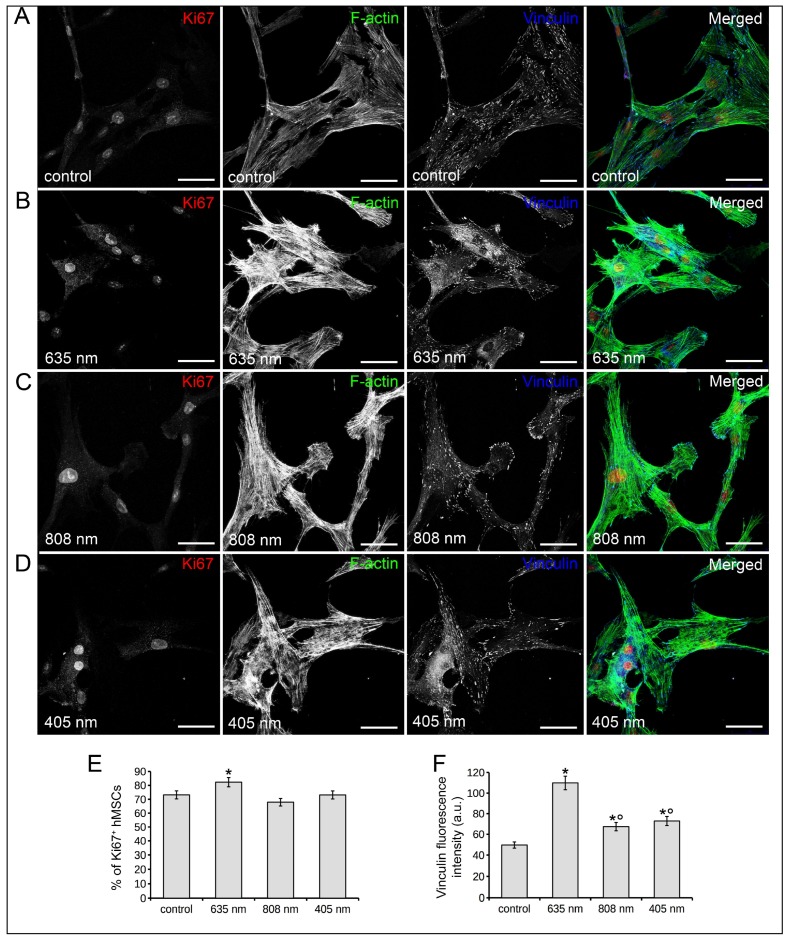
Effects of red (635 nm), NIR (808 nm) and violet-blue (405 nm) PBM on hMSC proliferation and cytoskeleton assembly. hMSCs subjected or not (control) to PBM treatments with 635 nm, 808 nm or 405 nm as reported in Table 1, were cultured for 24 h in PM. (A–D) Representative confocal fluorescence images of fixed cells in the indicated experimental conditions, immunostained with antibodies against the proliferation marker Ki67 (red) and against the focal adhesion protein vinculin (cyan) and stained with Alexa 488-conjugated phalloidin to reveal F-actin (green). Scale bar: 50 µm. (E) Quantitative analysis of Ki67 positive hMSC nuclei expressed as percentage of the total nuclei number. (F) Histogram showing the densitometric analysis of the intensity of vinculin fluorescence signal performed on digitized images. The data are representative of at least three independent experiments, performed in triplicate. The values are expressed as mean ± S.E.M. Significance of difference: * p < 0.05 vs. control, ° p < 0.05 vs. 635 nm.

