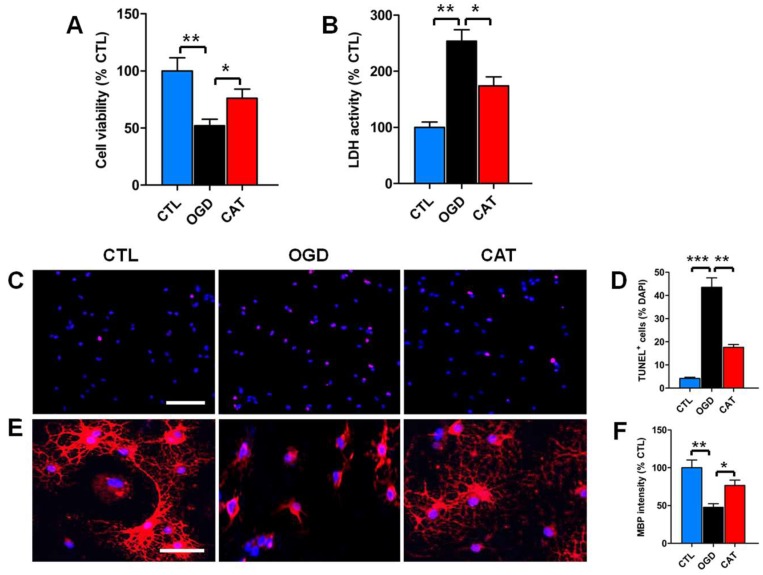
Figure 2.
Effects of catalpol on PreOL survival and maturation under oxygen-glucose deprivation (OGD). (A) Quantification of cell viability as measured by the 3-(4,5-dimethylthiazol-2-yl)-2,5-diphenyltetrazolium bromide (MTT) assay in the control (CTL), OGD-treated (OGD), and catalpol-treated (CAT) groups. (B) Quantification of lactate dehydrogenase (LDH) activity in the CTL, OGD, and CAT groups. (C) Representative terminal deoxynucleotidyl transferase-mediated dUTP-biotin nick end labeling assay (TUNEL) staining (red) in the CTL, OGD, and CAT groups. Cell nuclei were counterstained with 4′,6′-diamidino-2-phenylindole (DAPI) (blue). Bar = 50 μm. (D) Quantification of TUNEL-positive cells in the CTL, OGD, and CAT groups. (E) Representative MBP staining (red) in the CTL, OGD, and CAT groups. Cell nuclei were counterstained with DAPI (blue). Bar = 25 μm. (F) Quantification of the optical density of MBP staining in the CTL, OGD, and CAT groups. Data are shown as means ± SEM (n = 6 in each group). * p < 0.05; ** p < 0.01; *** p < 0.001.

