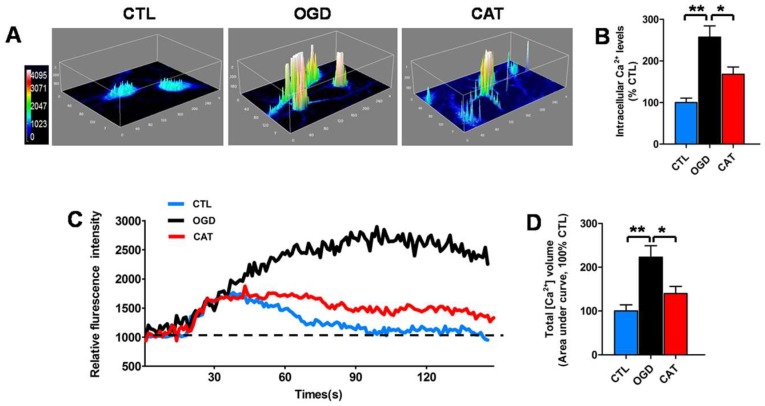
Figure 3.
Effects of catalpol on intracellular Ca2+ levels in PreOLs under OGD. (A) Representative 3D images of Fluo-3 staining in the CTL, OGD, and CAT groups. Intracellular Ca2+ levels (Fluo-3 staining) at the resting condition are indicated with a pseudocolor range (left side, color scale 0–4095). (B) Quantification of the fluorescence intensity of Fluo-3 in the CTL, OGD, and CAT groups. (C) Representative Ca2+ response traces under high-glucose stimulation in the CTL, OGD, and CAT groups. (D) Quantification of total volume of intracellular Ca2+ under high-glucose stimulation in the CTL, OGD, and CAT groups. The area under the curve represents the total volume of intracellular Ca2+. Six separate experiments were conducted and 15–30 cells were recorded for each experiment. Data are shown as means ± SEM. * p < 0.05; ** p < 0.01.

