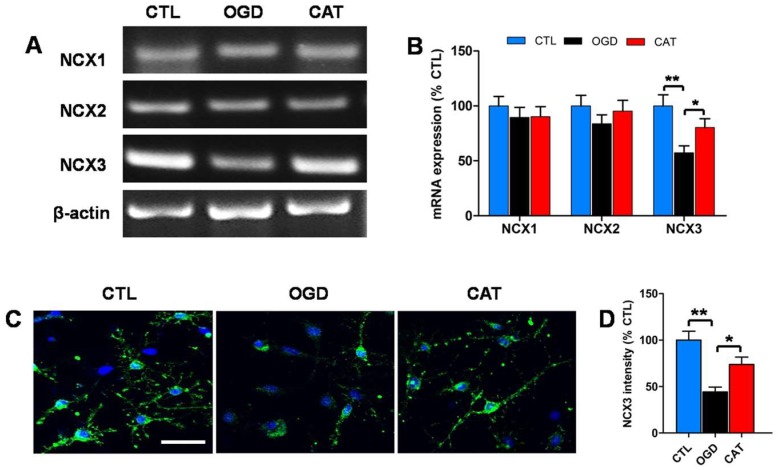
Figure 4.
Effects of catalpol on Na+/Ca2+ exchanger 3 (NCX3) expression in PreOLs under OGD. (A) RT-PCR to probe Na+/Ca2+ exchanger 1 (NCX1), Na+/Ca2+ exchanger 2 (NCX2), and NCX3 mRNA levels in the CTL, OGD, and CAT groups. β-actin was used as control. (B) Quantification of NCX1, NCX2, and NCX3 mRNA levels from the RT-PCR analyses. (C) Representative NCX3 staining (green) in the CTL, OGD, and CAT groups. Cell nuclei were counterstained with DAPI (blue). Bar = 25 μm. (D) Quantification of the optical density of NCX3 staining in the CTL, OGD, and CAT groups. Data are shown as means ± SEM (n = 6 in each group). * p < 0.05; ** p < 0.01.

