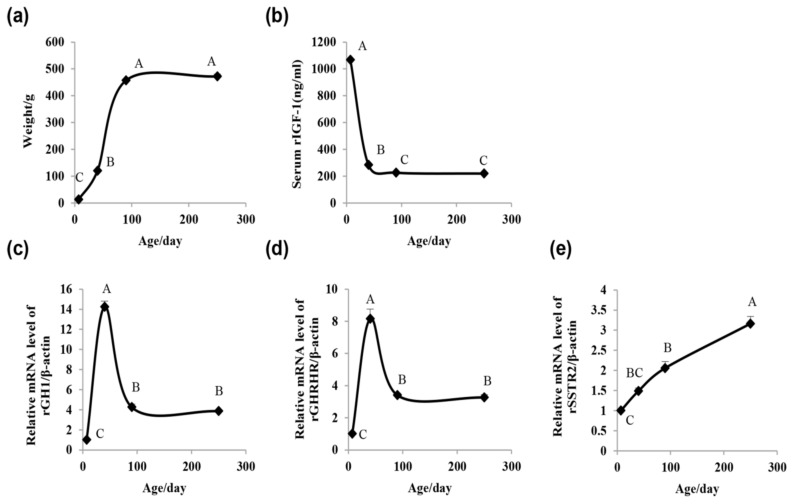
Figure 1.
Rat growth curve, serum insulin-like growth factor 1 (IGF-1) concentration, and pituitary growth hormone 1 (GH1), growth hormone-releasing hormone receptor (GHRHR), and somatostatin receptor 2 (SSTR2) messenger RNA (mRNA) expression. (a) Sprague-Dawley (SD)rats growth curve. (b) SD-rat serum IGF-1 concentrations. (c–e) Alteration of pituitary GH1, GHRHR, and SSTR2 mRNA expression. The four points in each figure represent the different ages (Day 7, Day 40, Day 90, and Day 250). The values are expressed as the means ± standard error of the mean (SEM). Means with different letters were significantly different (n = 8; p < 0.01; ANOVA; Tukey-HSD).

