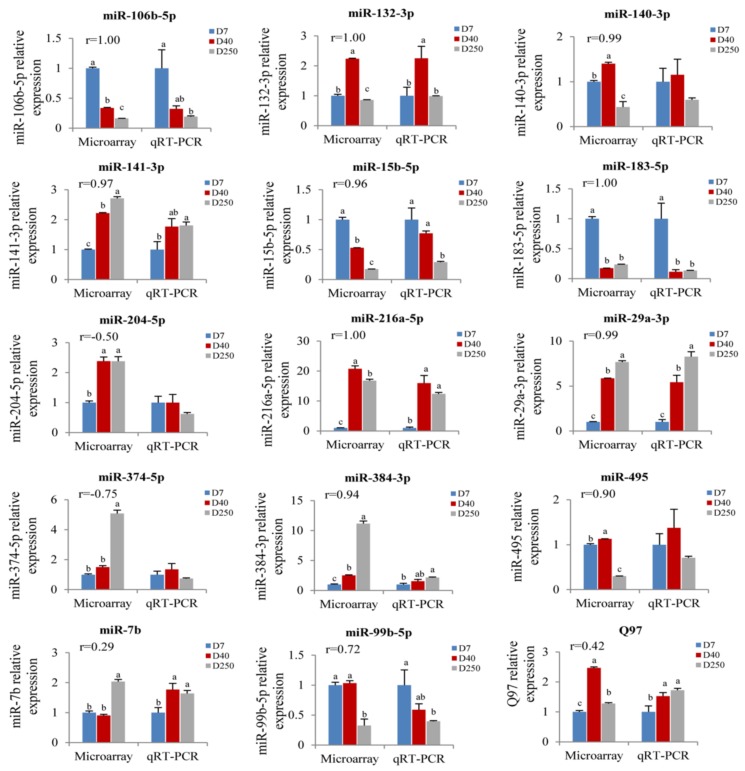
Figure 5.
Validation of the microarray results by real-time PCR. Expression level of 15 miRNAs was detected by microarray (left) and real-time PCR (right). All data are represented as the means ± SEM. A Pearson correlation coefficient (r) was performed to determine the consistency between the real-time PCR and microarray data. The expression abundance on Day 7 was normalized to 1. Statistical significance was determined by a one-way ANOVA followed by a Tukey-HSD test. p < 0.05 was considered as statistically significant, and the column of each group with different letters and same letters, respectively, represent statistically significant and insignificant. The column with double letters means that this set of data is not significant with other two sets of data.

