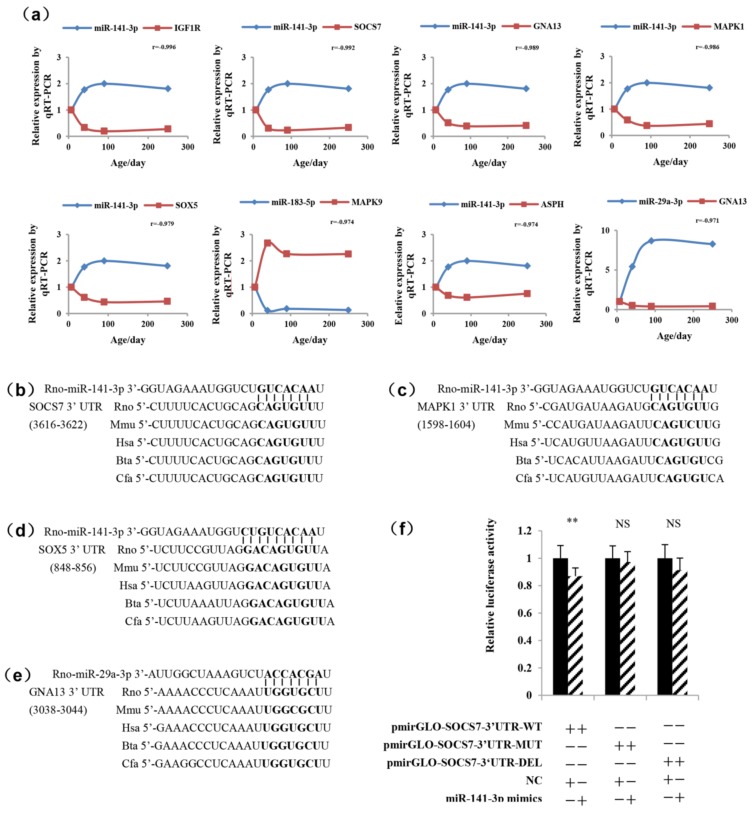
Figure 6.
Temporal expression patterns and conservation analysis of negatively correlated miRNA/mRNA gene pairs. (a) The expression levels of the eight miRNAs/mRNA gene pairs were detected by real-time PCR. The blue curves and red curves, respectively, represent miRNAs and their predicted genes expressions. All data are represented as the mean ± SEM. A Pearson correlation coefficient (r) was performed to determine the correlation between the miRNAs and mRNAs. The seed regions of miR-141-3p and the seed-recognizing sites in the SOCS7 3′UTR (b), MAPK1 3′UTR (c), and SOX5 3′UTR (d) and the seed regions of miR-29a-3p and the seed-recognizing sites in the GNA13 3′UTR (e) are indicated in boldface type. All nucleotides in the seed-recognizing sites were completely conserved in several species. Rno, Rattus norvegicus; Mmu, Mus musculus; Hsa, Homo sapiens; Bta, Bos taurus; Cfa, Canis familiaris. (f) Relative luciferase activities were detected after the Hela cells were co-transfected with pmirGLO-SOCS7-3′UTR-(WT/MUT/ DEL) plasmid and negative control (NC) or miR-141-3p mimics. Results are presented as means ± SEM (n = 8). **, p < 0.01; NS, not significant (p > 0.05).

