Figure 5.
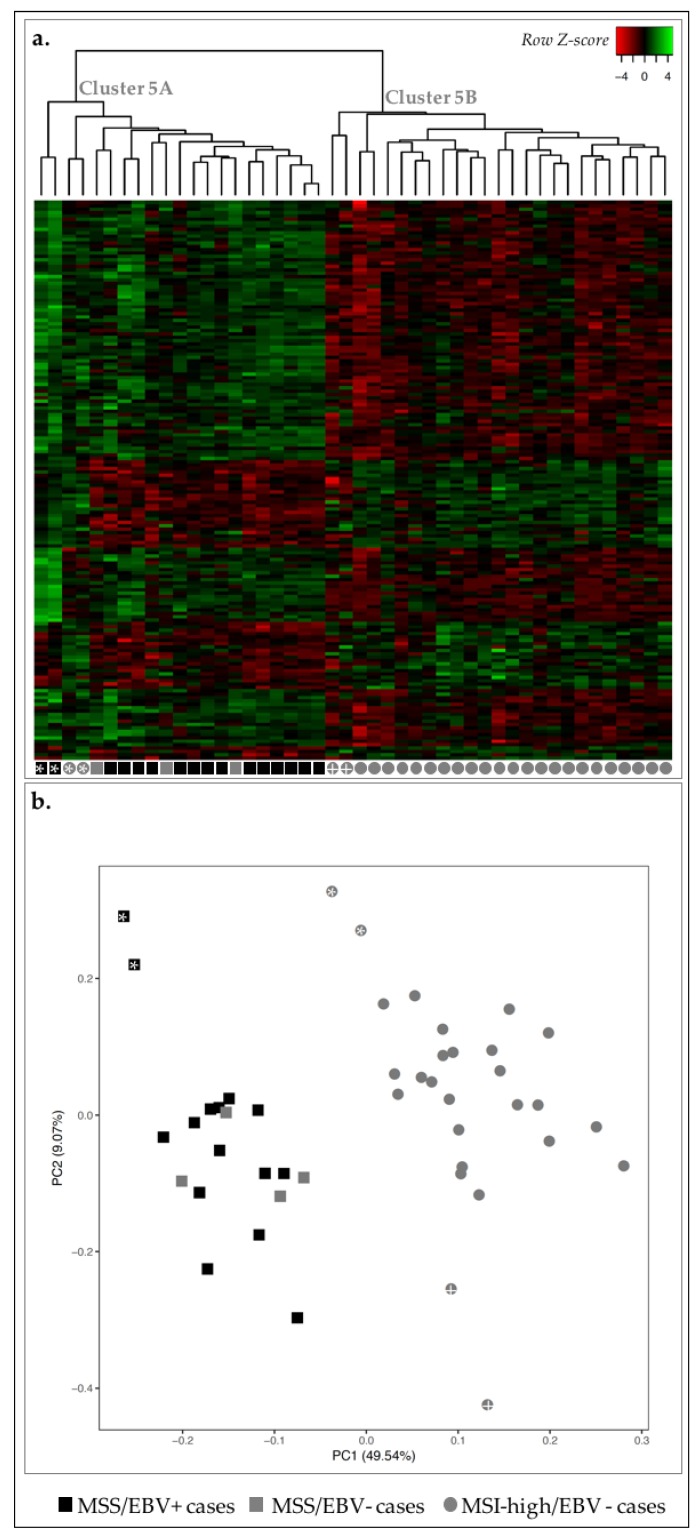
Expression profile of the 46 GC cases for 166 DE-genes between MSS/EBV+ and MSI-high/EBV− cases. (a) Heatmap for the expression of the 166 DE-genes (log 2 and Z-score scaled). Indicated are two main clusters: A and B. (b) PCA for principal components 1 and 2 for the 46 GC samples. Black squares correspond to MSS/EBV+ cases (n = 15), gray squares to MSS/EBV− cases (n = 4) and gray circles to MSI-high/EBV− cases (n = 27).

