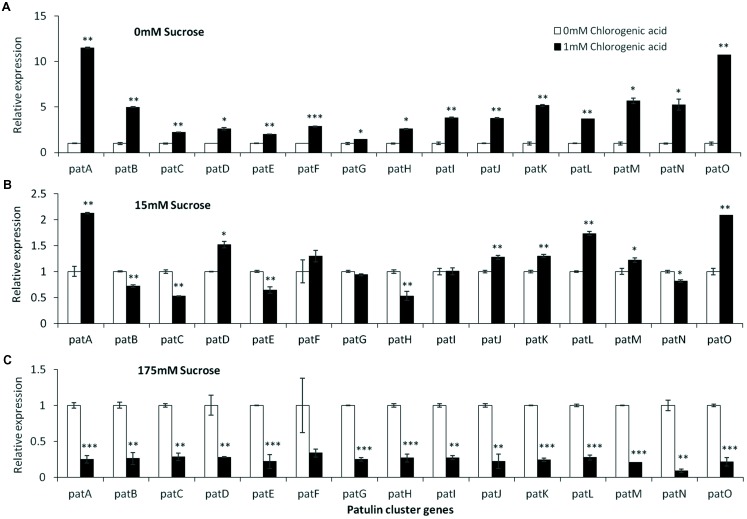
FIGURE 7.
pat genes cluster (PGC) relative expression as affected by chlorogenic acid and different levels of sucrose. Solid SM media at initial pH 5.0 amended with 0 (A), 15 (B), and 175 mM (C) sucrose was combined with increasing concentrations of chlorogenic acid from 0 and up to 1 mM. The media was inoculated with 100 μl of a 106 spore/ml suspension and the relative expression patA, patB, patC, patD, patE, patF, patG, patH, patI, patJ, patK, patL, patM, patN, patO between both treatments were compared. Expression was evaluated 3 days post-inoculation after the mycelia was sampled from the culture plates. Average values (±SE) of five replicates are reported. Experiments were repeated three times and results of a single representative experiment are shown. For statistical analysis, the unpaired student t-test was used with significance defined as a P value (∗P ≤ 0.05; ∗∗P ≤ 0.01; ∗∗∗P ≤ 0.001).

