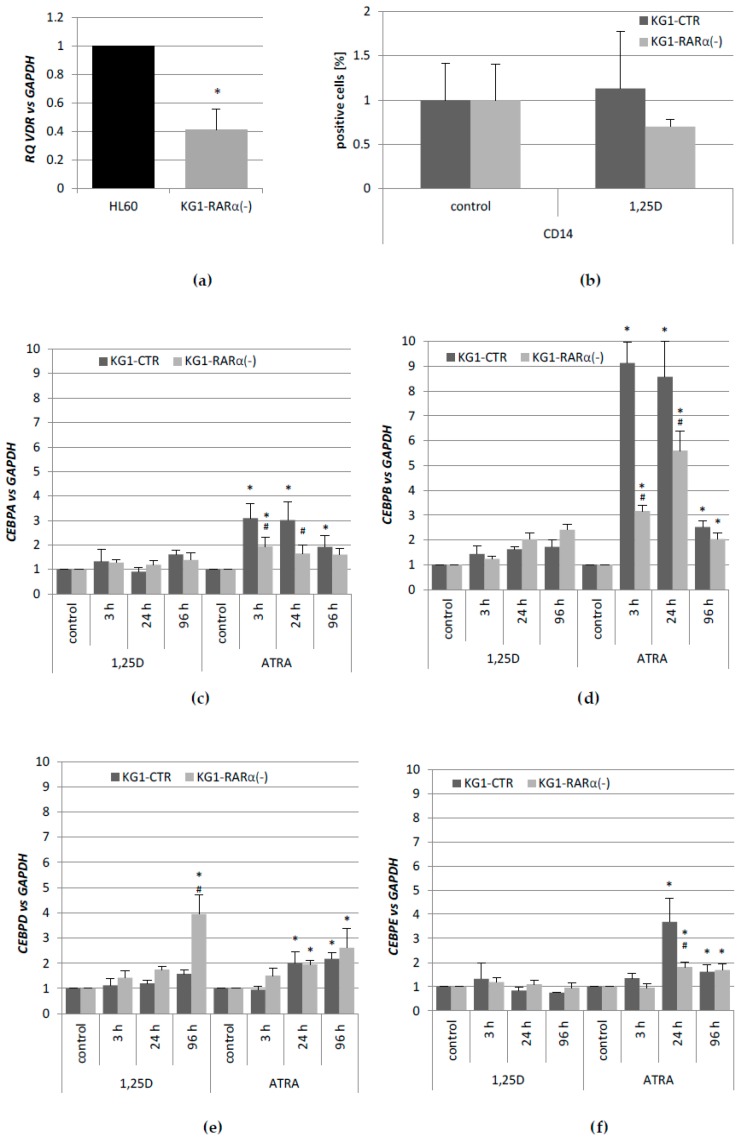
Figure 3.
Responses to 1,25D and to ATRA in KG1 cells with silenced retinoic acid receptor α (RARA) gene. Expression of vitamin D receptor (VDR) gene in KG1-RARα(−) cells compared to HL60 cells, which were treated as calibrator (a). Differentiation of KG1 sublines in response to 1,25D. KG1-CTR and KG1-RARα(−) cells were stimulated with 10 nM 1,25D for 96 h and then the expression of CD14 differentiation marker was detected using flow cytometry (b). Expression of CEBPA (c), CEBPB (d), CEBPD (e), and CEBPE (f) genes in KG1-CTR and KG1-RARα(−). Cells were stimulated with 10 nM 1,25D or 1 µM ATRA and after desired time the expression of CEBP genes was measured by Real-time PCR. The bars represent mean values of the fold changes (±SEM) in mRNA levels relative to GAPDH mRNA levels. Expressions in control cells were treated as calibrators. Values that are significantly different from those obtained from respective controls cells are marked with asterisk (* p < 0.05); values that differ significantly from those obtained from respective KG1-CTR control cells are marked with hash (# p < 0.05).

