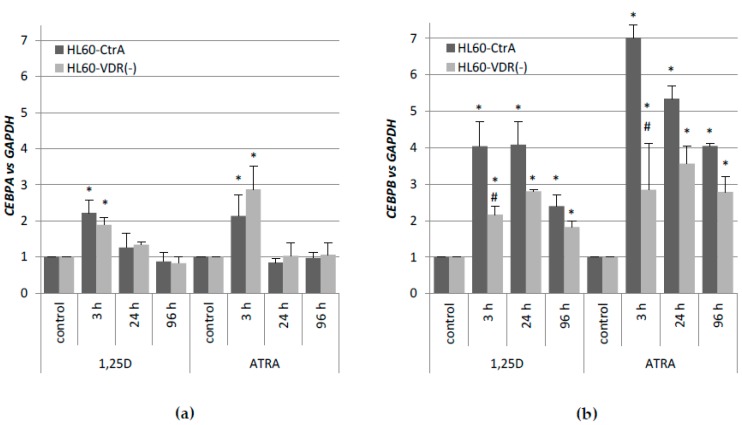
Figure 5.
Expression of CEBPA (a) and CEBPB (b) genes in HL60-CtrA and HL60-VDR(−). Cells were exposed to 10 nM 1,25D or 1 µM ATRA and after desired time the expression of CEBP genes was measured by Real-time PCR. The bars represent mean values of the fold changes (±SEM) in mRNA levels relative to GAPDH mRNA levels. Expressions in control cells were treated as calibrators. Values that are significantly different from those obtained from respective controls cells are marked with an asterisk (* p < 0.05); values that differ significantly from those obtained from respective HL60-CtrA cells are marked with hash (# p < 0.05).

