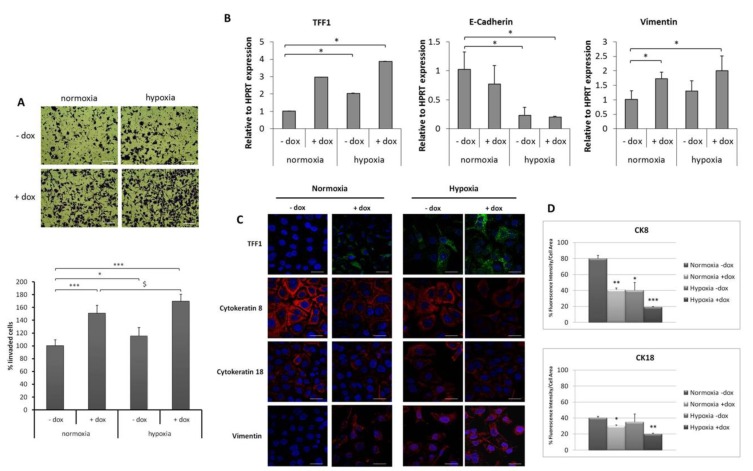
Figure 4.
Effect of TFF1-enriched conditioned medium (CM) on the invasive ability of AGS cells and the expression of EMT markers. (A) Invasion through Matrigel of AGS cells treated with conditioned medium from AGS-AC1 cells (CM, −dox) or from TFF1 hyper-expressing AGS-AC1 cells (CM, +dox) and incubated for 24 h in normoxia or hypoxia. Upper panel, bottom surface of filters stained with crystal violet. Magnification 10×. Bar = 100 μm. Lower panel, quantification of invasive cells relative to normoxia. * p < 0.05 and *** p < 0.001 vs. normoxic CM, −dox controls, $ p < 0.05 vs. AGS CM, +dox treated cells in normoxia; (B) qRT-PCR for TFF1, E-cadherin, and vimentin mRNA expression in AGS cells treated with CM, −dox or CM, +dox of AGS-AC1 cells under normoxia or hypoxia for 48 h. Data are normalized on mRNA levels of HPRT in the same experimental models. Statistically significant differences at p < 0.05 from normoxic CM, −dox controls are indicated (*); (C) Immunofluorescence images of TFF1, vimentin, and cytokeratin-8 and-18 on AGS cells treated with CM, −dox or CM, +dox of AGS-AC1 cells under normoxia or hypoxia for 48 h. Nuclei were stained with DAPI. Magnification 63×. Bar = 10 μm; (D) Quantification of cytokeratin-8 and -18 as percent of fluorescence intensity per cell area from corresponding panels in (D). Statistical analyses for significance of results were performed using Student’s t-test, assuming a two-tailed distribution and unequal variance. * p < 0.05, ** p < 0.01, *** p < 0.001.

