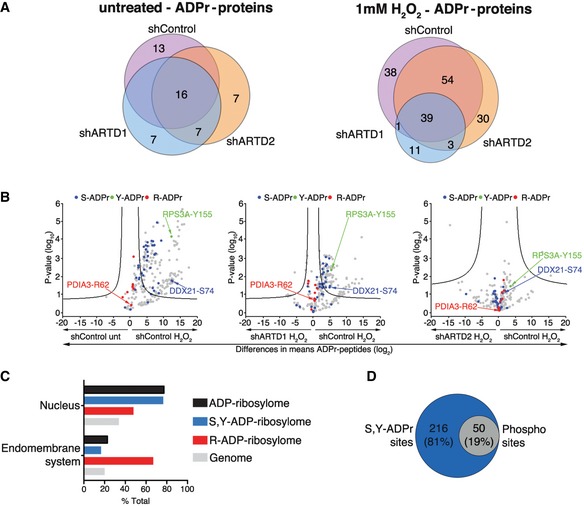
Figure 3. ARTD1 mediates proteome‐wide S‐ and Y‐ADP‐ribosylation.

- Venn diagrams indicate the overlap of ADP‐ribosylated proteins identified in untreated and H2O2‐treated HeLa cells following ARTD1 or ARTD2 knockdown.
- Volcano plots comparing ADP‐ribosylated peptides identified in the different cell lines and conditions. ADP‐ribosylation sites confirmed by EThcD spectra are color‐coded for S‐ADPr (blue), Y‐ADPr (green), and R‐ADPr (red) modifications. Serine (DDX21), tyrosine (RPS3A), and arginine (PDIA3) modifications that were identified within our ADPr localization training spectra library are annotated. The black hyperbolic line represents a permutation‐based false discovery rate (FDR) of 5% and a minimal fold change of 2.
- Gene ontology cellular localization annotation of ADP‐ribosylated proteins following H2O2 treatment: Only SRY ADP‐ribosylated proteins with a Mascot localization score > 90% were considered.
- Comparison of the S‐ and Y‐ADP‐ribosylation identified here with the HeLa phosphoproteome identified by Sharma et al 20.
