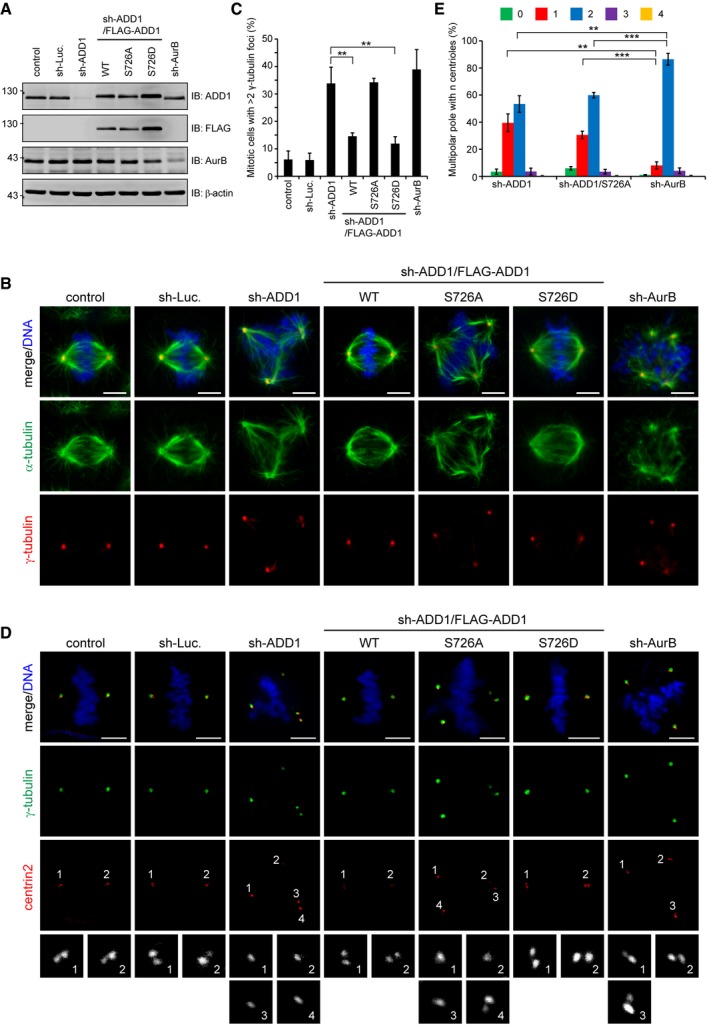
HeLa cells were infected with lentiviruses expressing shRNAs specific to ADD1 (sh‐ADD1), Aurora‐B (sh‐AurB), or luciferase (sh‐Luc.). FLAG‐ADD1 WT or mutants (S726A and S726D) were re‐expressed into the cells whose endogenous ADD1 had been depleted. Equal amounts of whole‐cell lysates were analyzed by immunoblotting (IB) with the indicated antibodies.
The cells were stained for γ‐tubulin (red), α‐tubulin (green), and DNA (blue). Scale bars, 5 μm.
The percentage of multiple γ‐tubulin foci in the total counted mitotic cells was measured (302–568 mitotic cells were counted in each group).
The cells were stained for γ‐tubulin (green), centrin2 (red), and DNA (blue). The insets show magnification of the centrin2 signal at the indicated poles. Scale bars, 5 μm.
The percentage of spindle poles with n centrioles found in cells with multiple γ‐tubulin foci was assessed (411–805 poles were counted in each group).
Data information: In (C and E), values (means ± s.d.) are from three independent experiments. **
P < 0.01 and ***
P < 0.001 (Student's
t‐test). For clarity, not all significances are indicated.
Source data are available online for this figure.

