
Figure 1. The ERK‐dependent phosphoproteome in ES cells.
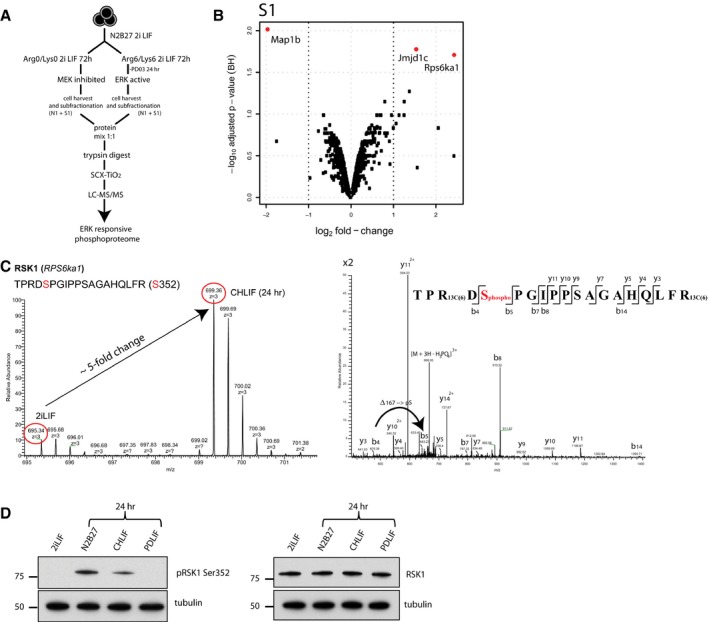
- Experimental workflow.
- Volcano blot illustrating fold changes and statistical significance of identified phosphopeptides from the S1 fraction. Red circles represent log2 fold changes with P‐adj < 0.05. Results are from identifications in three independent experiments.
- MS1 and MS2 mass spectra of RSK1 phosphopeptide. Left panel: The monophosphorylated peptide exhibits an approximate fivefold increase when ERK is active. Right panel: Fragmentation mass spectrum. Phosphorylation at Ser352 could be deduced from a mass increment of 167 Da between ions b4 and b5.
- Immunoblots of pRSK1 (Ser352) and total RSK1 in ES cells in the indicated conditions.
Source data are available online for this figure.