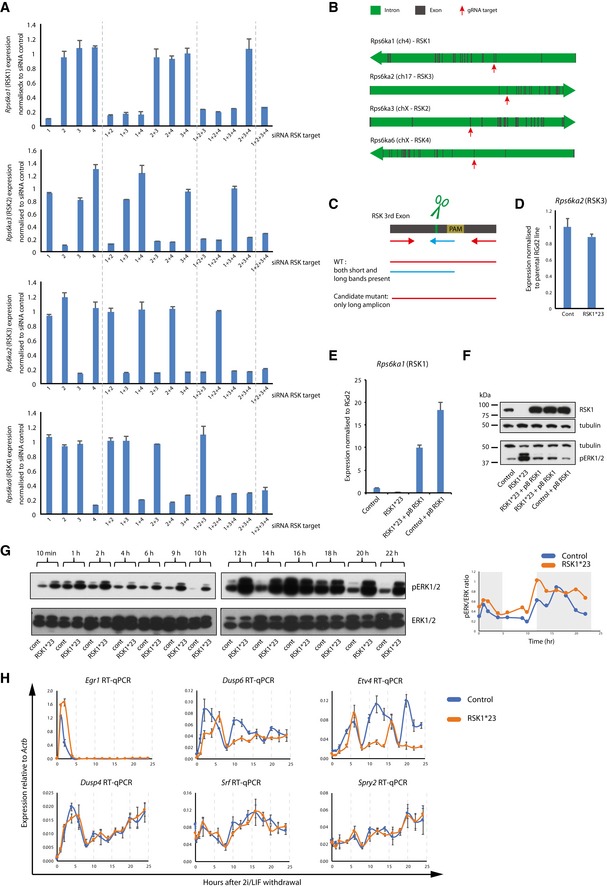
Figure EV2. RSK knockdown, knockout and rescue. Related to Fig 2 .

- ES cells were transfected with RSK isoform‐specific siRNAs in 2i and gene expression analysed 48 h after transfection. 1 = RSK1; 2 = RSK2; 3 = RSK3; 4 = RSK4. The Ct values are calculated relative to Gapdh and normalised to scrambled siRNA. Mean and SD shown; n = 2.
- RSK gene structure. Introns are shown in green and exons in grey. Red arrows indicate exon targeted by gRNAs.
- Genomic PCR strategy to identify potential candidate clones. For each gene, a three‐primer PCR was carried out. Wild‐type clones resulted in two bands (larger one—red–red primer pairing, and smaller one—red–blue primer pairing). An indel would result in reduced binding of the internal primer (blue) and amplification of only the large fragment.
- Rps6ka2 (RSK3) expression analysis in mutant lines. Expression is relative to Gapdh and normalised to RGd2 parental line. Mean and SD shown; n = 2.
- Rps6ka1 (RSK1) expression analysis in mutant and rescue lines. Expression is relative to Gapdh and normalised to RGd2 parental line. Mean and SD shown; n = 2.
- Immunoblot analysis of RSK1 and pERK1/2 in mutant cells after stable transfection with an RSK1 expression vector. Lysates were collected 1 h after 2i/LIF withdrawal. Control is a clone picked in parallel to RSK1*23 which was not targeted by gRNAs.
- RSK1*23 and parental cells were exchanged from 2iLIF into N2B27 for 22 h and cell lysates at indicated time points. Expression of pERK and ERK was detected by immunoblotting. Second biological replicate shown. Expression of pERK and ERK was quantified using Fiji and the pERK/ERK ratio plotted (right pannel). Grey areas highlight pERK/ERK peaks in the first replicate.
- Expression of pERK target genes in control and RSK1*23 cell lines after withdrawal of 2i/LIF. Expression relative to Actb. Mean and SD shown; n = 2.
Source data are available online for this figure.
