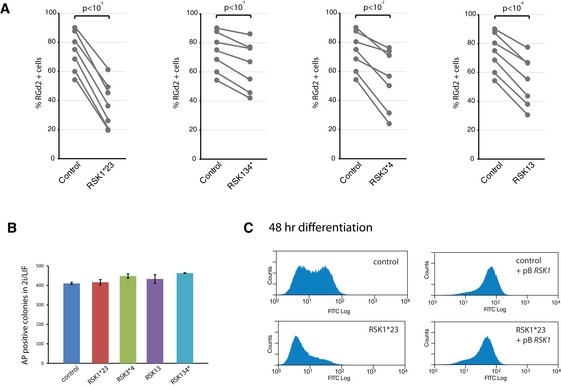
Figure EV3. Colony formation efficiency of RSK mutant cells and GFP expression after RSK1 rescue. Related to Fig 3 .

- Quantification of percentage of RGd2‐positive cells across experiments, at different time points. Lines indicate experiments plated and analysed at the same time. n = 7 across different time points; paired t‐test shown.
- One thousand cells were plated per 6 wells in 2iLIF and colonies stained for AP on day 5. Columns show numbers of AP+ colonies. Mean and SD shown; n = 2.
- Flow cytometry analysis of RSK1‐transfected RSK1*23 cells. Cells were withdrawn from 2iLIF for 48 h and analysed for GFP. Control is a clone picked in parallel to RSK1*23 which was not targeted by gRNAs.
