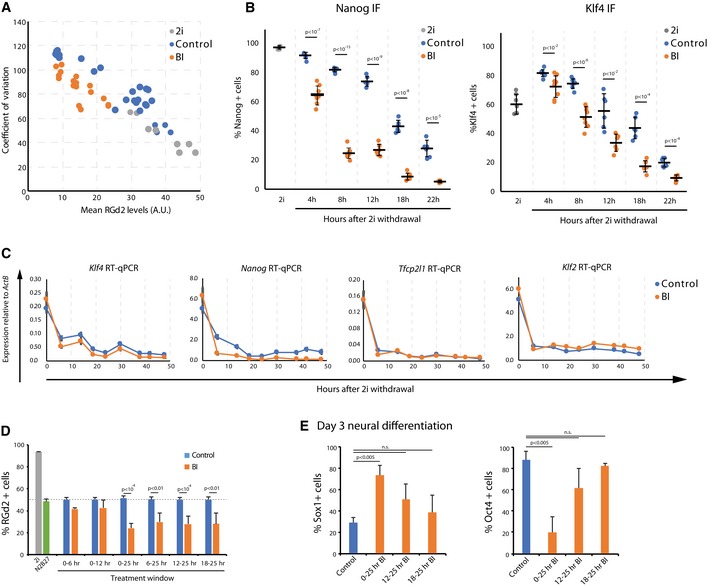
Figure EV4. Treatment with BI at different time points. Related to Fig 5 .

- Mean RGd2 fluorescence levels plotted against the coefficient of variation for cells in 2i, or differentiated in BI or control for different time points.
- Percentage of Nanog‐positive and Klf4‐positive cells over the differentiation time‐course in the presence of BI or control. Mean and SD shown; n = 3; unpaired two‐tailed Student's t‐test.
- Bulk mRNA expression of naïve pluripotency factors in a differentiation experiment in the presence or absence of BI. Expression is relative to Actb. Mean and SD shown; n = 2.
- Percentage of RGd2‐positive cells when BI is added at different intervals, relative to control, DMSO‐treated, cells. Mean and SD shown; n = 3; unpaired two‐tailed Student's t‐test.
- Percentage of Sox1‐ and Oct4‐positive cells on day 3 of neural differentiation when BI was added at different intervals. Mean and SD shown; n = 3; unpaired two‐tailed Student's t‐test.
