
Figure 1. Engineered cell microenvironments in PEG hydrogels and their modification by BM‐MSC‐derived ECM .
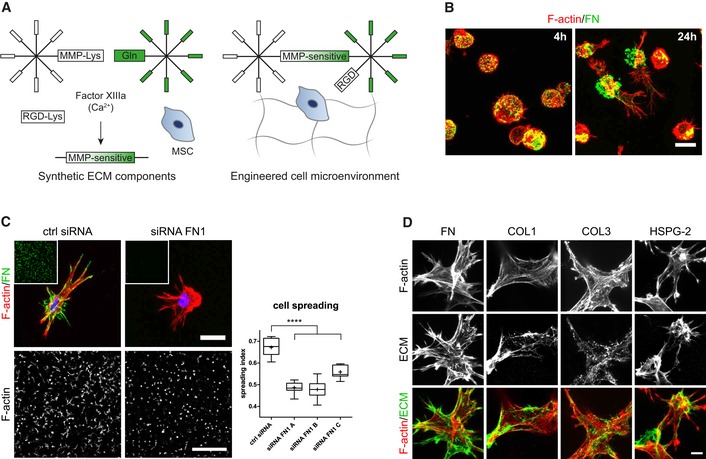
- Schematic of synthetic, FXIIIa cross‐linked PEG hydrogels containing the integrin adhesion ligand RGD and MMP‐sensitive sites.
- BM‐MSCs (F‐actin, red) secreted and deposited cell‐derived fibronectin (green) to sites of initial embedment in PEG hydrogels after 4 and 24 h of culture. Scale bar: 20 μm.
- Cellular fibronectin modulated spreading of BM‐MSCs. Representative individual cells with intact or knockdown fibronectin expression after 3 days of culture within PEG hydrogels. Scale bar: 20 μm. Insets show overview images of the fibronectin stained hydrogels (green) at the same low magnification as the representative F‐actin images used for quantification of spreading (Scale bar: 500 μm). Quantification of cell spreading: Spreading index between 0 for circular cells and 1 for elongated cells. Box plot (25th and 75th percentiles) with whiskers (5th and 95th percentiles), median (line) and mean (+), n = 9, ANOVA with Bonferroni's post hoc test ****P < 0.0001.
- Representative immunofluorescence images of BM‐MSCs (F‐actin, red) and deposited ECM components (green) after 7 days of culture within PEG hydrogels. Scale bar: 10 μm.