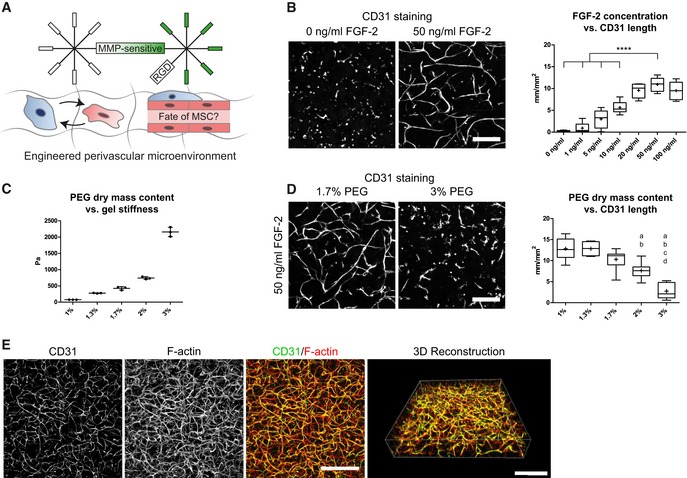
Figure 2. Engineering of 3D perivascular microenvironments by defining parameters for micro‐capillary formation.

-
AEngineering of perivascular microenvironments by the co‐culture of MSCs and endothelial cells (EC), resulting in the cell‐autonomous establishment of micro‐capillaries containing perivascular localized MSCs.
-
B–D(B, D) Representative immunofluorescence images of micro‐capillary networks formed by BM‐MSCs and endothelial cells (CD31) after 7 days of 3D co‐culture in PEG hydrogels. Scale bars: 200 μm. (B) Quantitative analysis of the absolute length of CD31‐positive networks depending on FGF‐2 concentration (n = 6, ANOVA with Bonferroni's post hoc test ****P < 0.0001) and (D) physical matrix properties by PEG dry mass content [n = 8, ANOVA with Bonferroni's post hoc test shows significant differences from 1% PEG (a), 1.3% PEG (b), 1.7% PEG (c), and 2% PEG (d)]. Box plots in (B and D) show 25th and 75th percentiles with whiskers at 5th and 95th percentiles, median (line), and mean (+). (C) Correlation of PEG dry mass content and matrix stiffness assessed by rheological measurement of the corresponding storage moduli, n = 3, individual data points and mean (line) ± SD.
-
C3D micro‐capillary network formed by co‐cultures of BM‐MSCs and endothelial cells in 1.7% PEG matrices and in the presence of 50 ng/ml FGF‐2. Scale bars: 500 μm.
Source data are available online for this figure.
