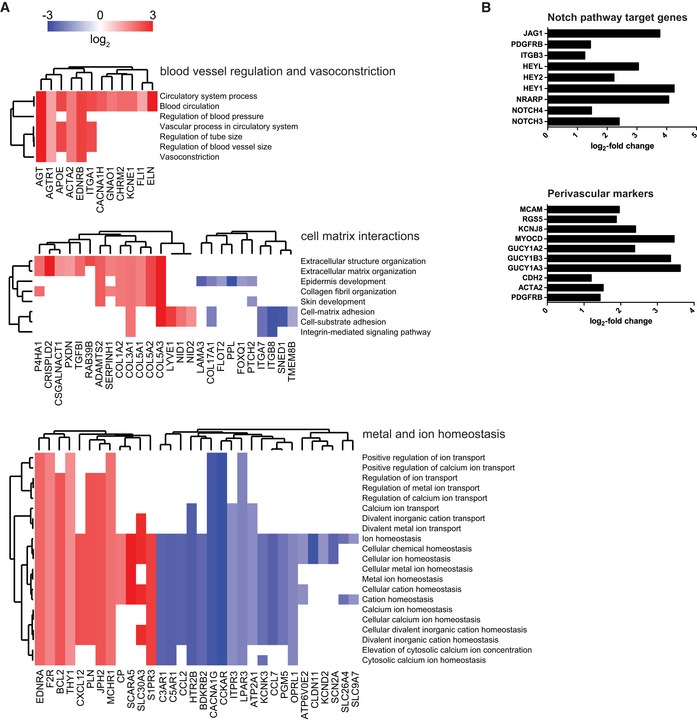
Figure EV4. Functional enrichment map of differentially expressed genes (DEG) and induction of Notch pathway target genes and perivascular markers in BM‐MSCs isolated from micro‐capillary networks.

- Genes identified as DEG following transcriptome analysis are enriched and clustered by the gene ontology domain GO Biological Process. Up‐ and downregulated genes in perivascular BM‐MSCs are displayed in red and blue, respectively. GO Biological Process clusters show clusters of blood vessel regulation, cell–matrix interactions, and metal and ion homeostasis (a list of differentially expressed genes with their corresponding Biological Process terms is displayed in Dataset EV3).
- Induction of Notch pathway target genes and perivascular markers in BM‐MSCs isolated from micro‐capillary networks. Log2‐fold change of identified differentially expressed genes following transcriptome analysis in BM‐MSCs isolated from micro‐capillary networks compared to monocultured BM‐MSCs.
Source data are available online for this figure.
