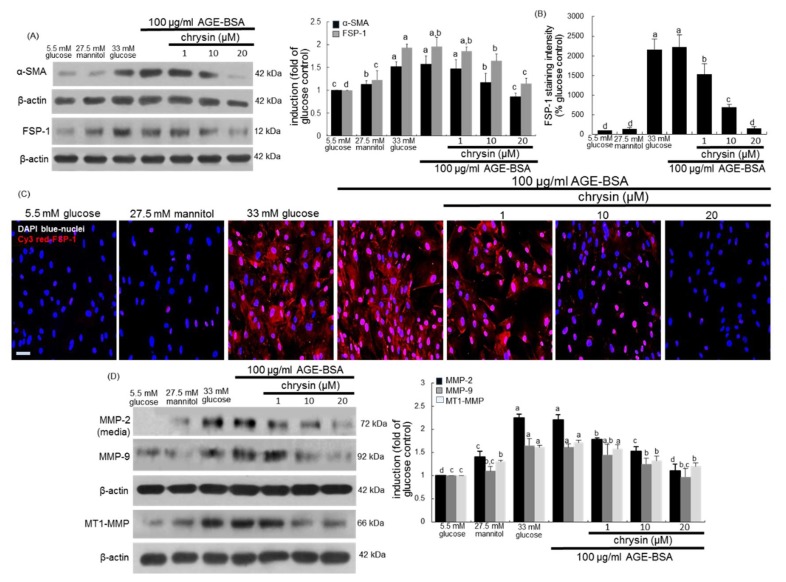
Figure 6.
Suppressive effects of chrysin on cellular induction of α-SMA, fibroblast specific protein (FSP)-1, MM-2, MMP-9 and MT1-MMP in AGE-exposed HRMC. Renal mesangial cells were challenged for 3 days with 100 μg/mL AGE-BSA in the absence and presence of 1–20 μM chrysin. Cell extracts and media were subject to Western blot analysis with a primary antibody against α-SMA, FSP-1, MMP-2, MMP-9 or MT1-MMP (A,D). β-Actin protein was used as an internal control. The bar graphs in the right panel represent densitometric results obtained from Image analysis. The FSP-1 induction in AGE-exposed cells was immunocytochemically visualized as fluorescent Cy3 staining and nuclear counter-staining was done with the blue stain DAPI (B,C). Each photograph is representative of four different experiments and fluorescent images were taken with a fluorescence microscope. Scale bar = 100 µm. Fluorescent Cy3 staining intensity of FSP-1 was measured using an optical Axiomager microscope system (B). Values in bar graphs (mean ± SEM, n = 3 independent experiments) not sharing a same lower case indicate significant different at p < 0.05.

