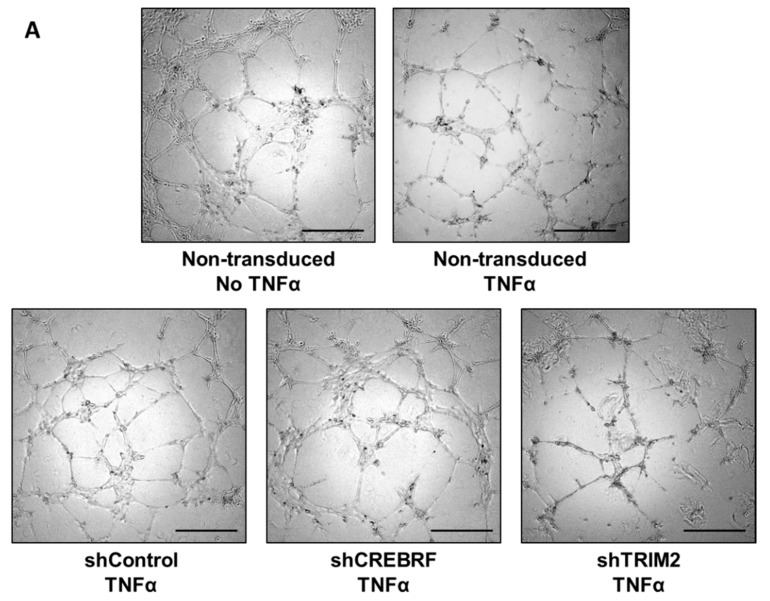
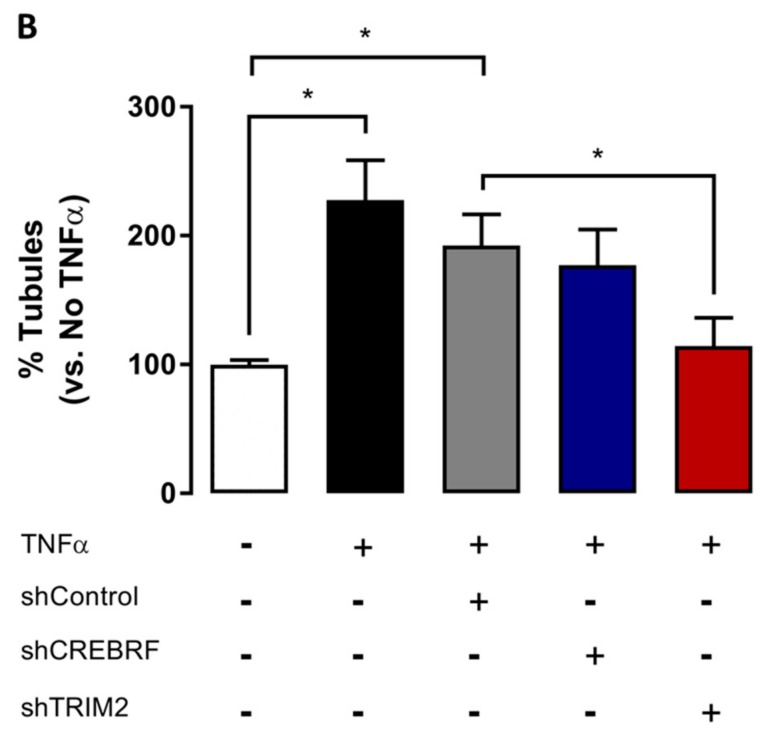
Figure 5.
Tubulogenesis following TNFα stimulation in HCAECs transduced with lentivirus containing shControl, shCREBRF or shTRIM2 compared to non-transduced non-TNFα-stimulated cells. (A) Representative images of tubule formation were photographed under light microscopy. Scale bars, 50 μm. (B) Number of tubules was counted and analyzed using ImageJ software. Results are mean ± SEM. * p < 0.05 by unpaired two-tailed t-test.


