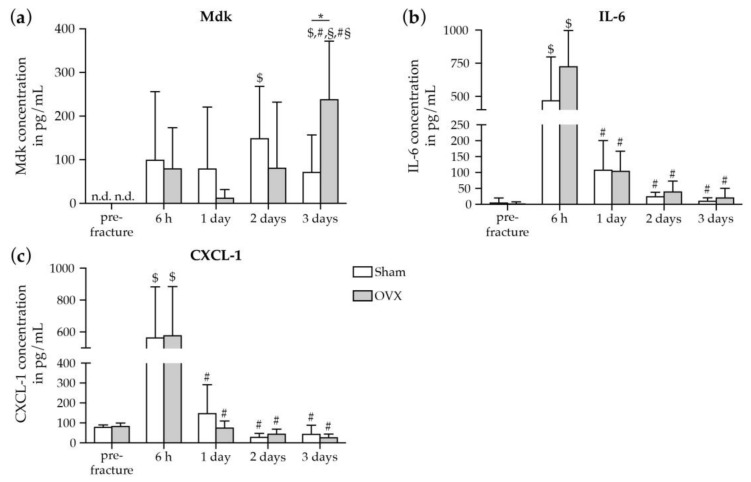
Figure 1.
Cytokine/chemokine concentrations in blood plasma of sham- and OVX-mice pre- and after fracture. Plasma levels of (a) Mdk, (b) IL-6, and (c) CXCL-1 in pg/mL. Data represent the mean and standard deviations. Comparison between the groups: *, p ≤ 0.05 vs. sham (Student′s t-test). Comparison within one group: $, p ≤ 0.05 vs pre-fracture, #, p ≤ 0.05 vs 6 h, §, p ≤ 0.05 vs. 1 day, #§, p ≤ 0.05 vs. 2 days (ANOVA with Post hoc Fisher′s LSD; n = 5–8 per group). n.d. = non-detected, Mdk = Midkine, IL-6 = Interleukin-6, CXCL-1 = chemokine (C-X-C motif) ligand-1.

