Figure 3.
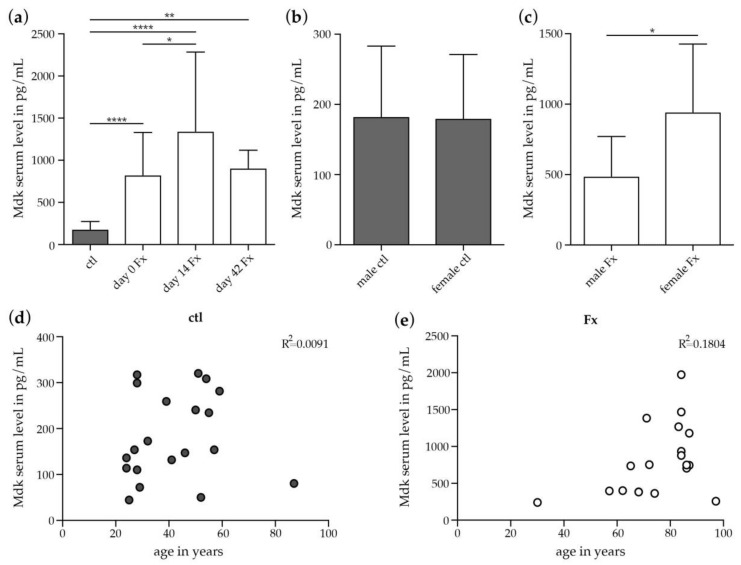
Mdk serum levels in patients with isolated long-bone fracture and healthy controls. (a) Mdk serum levels in healthy controls and in fracture patients at day 0, day 14 and day 42 after fracture. Ctl: n = 20; d0 Fx: n = 26; day 14 Fx: n = 7; day 42 Fx: n = 4; (b) Subgroup analysis of Mdk serum levels in male and female healthy controls. Male ctl: n = 10; female ctl: n = 10. (c) Subgroup analysis of Mdk serum levels in male and female fracture patients after menopause at day 0 after fracture. Male Fx: n = 6; female Fx: n = 13. (d) Pearson’s correlation analysis regarding Mdk serum levels and age in healthy controls. (e) Pearson’s correlation analysis regarding Mdk serum levels and age in fracture patients at day 0 after fracture. *, p ≤ 0.05, **, p ≤ 0.01, ****, p ≤ 0.0001, ANOVA with Post hoc Fisher’s LSD, Mdk = midkine, ctl = control, Fx = fracture.

