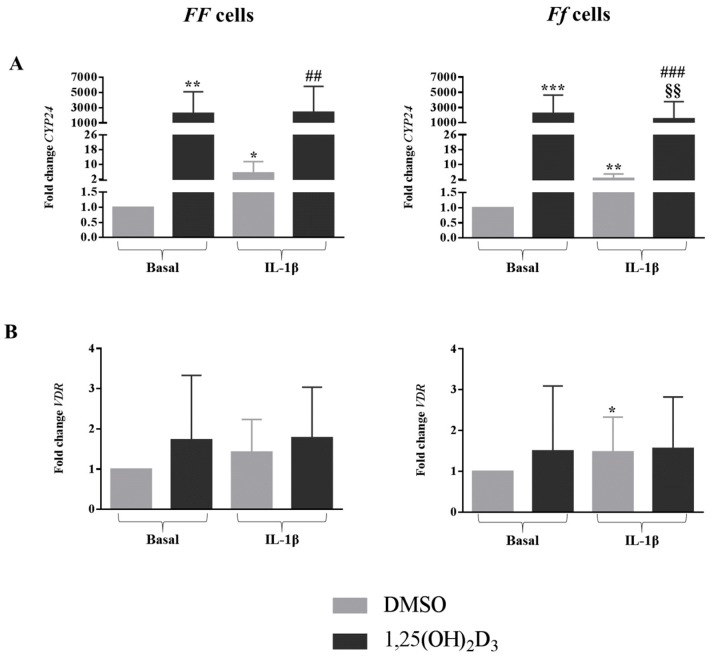
Figure 6.
Expression of genes related to vitamin D-dependent signaling pathway CYP24 (A) and VDR (B), in cells bearing FF and Ff genotypes, in basal and inflamed (IL-1β treatment) conditions, in response to vitamin D treatment. Light and dark gray bars represent the cells treated with DMSO and vitamin D, respectively. * p < 0.05, ** p < 0.01, *** p < 0.001 vs. DMSO treatment in basal condition. §§ p < 0.01, vs. vitamin D treatment in basal condition. ## p < 0.01, ### p < 0.001 vs. DMSO + IL-1β treatment. FF genotype n = 3, Ff genotype n = 7. Data are represented as mean ± SD.

