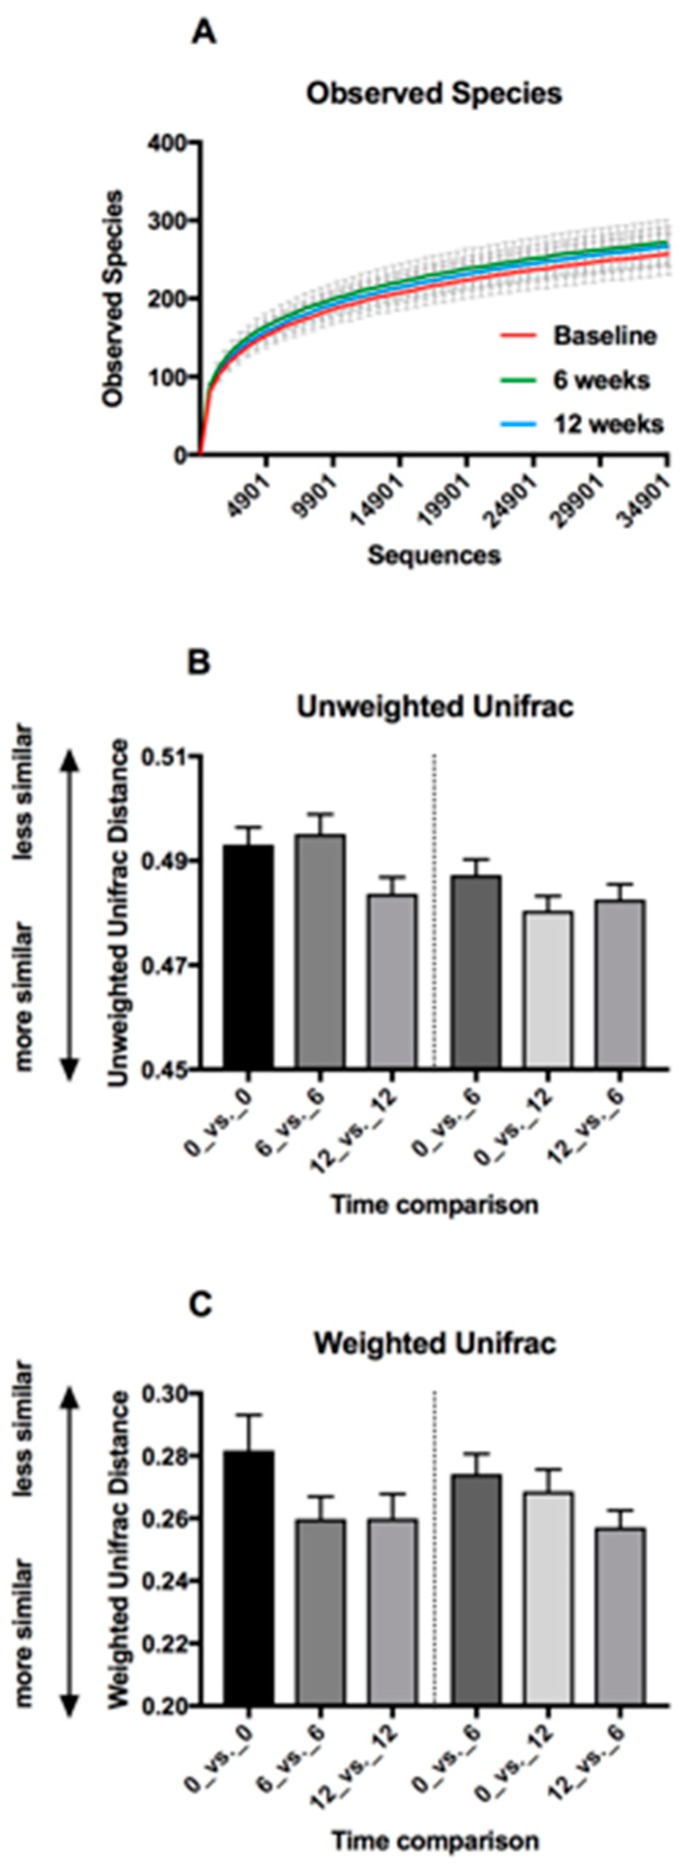
Figure 4.
Faecal microbiota diversity metrics. (A) Rarefaction curves based on Observed Species metric of alpha diversity, showing coverage of DNA sequences obtained from faecal DNA. Means and 95% CI are shown. (B,C) Beta diversity metrics comparing microbiota similarity distances within and between groups. Means and SEM are shown. (B) Unweighted Unifrac (kinds of bacteria and phylogenetic relatedness). (C) Weighted Unifrac (kinds of bacteria, phylogenetic relatedness and relative abundances).

