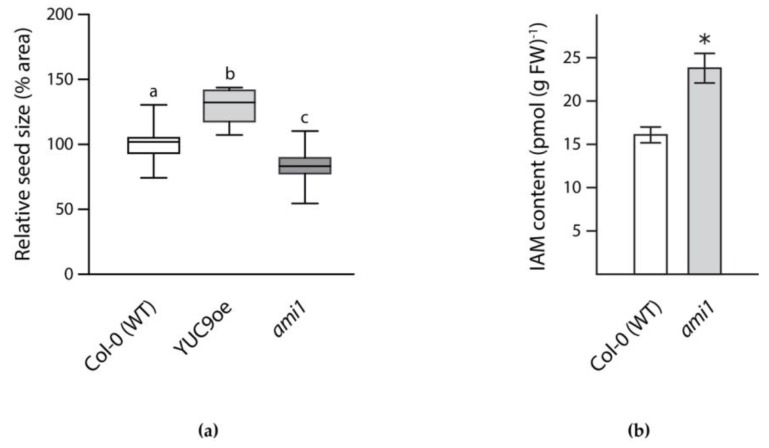
Figure 4.
Analysis of auxin mutants. (a) Seed size of two selected mutants relative to wild-type Arabidopsis seeds. Box plot showing the relative seed size of wild-type (white box), YUC9oe (light grey box), and ami1 (dark grey box) seeds. The values display the median, quartiles and extremes of the compared data sets, n = 16. Different letters indicate significant differences in seed size analyzed by ANOVA and Tukey’s B post-hoc test, p < 0.01; (b) Quantification of IAM levels in wild-type Arabidopsis and the ami1 T-DNA insertion line. Two-week-old seedlings were used for the determination of IAM by LC-MS analysis. Three independent biological replicates were assessed. Given is the standard error of the mean, n = 9 (Student’s t-test; * p < 0.05).

