Figure 4.
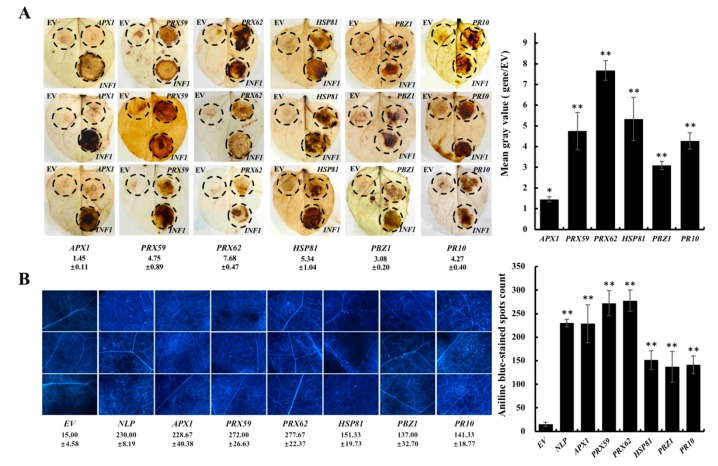
The DEP candidates contribute to callose deposition and ROS accumulation. (A) Left: 3,3′-diaminobenzidine (DAB) staining for reactive oxygen species (ROS) accumulation in N. benthamiana leaves after infiltration with A. tumefaciens carrying empty vector, PcINF1, and the six selected genes. The reddish-brown at the injection site shows the accumulation of ROS. Numbers are the relative accumulation and standard deviations of ROS using Image J. Right: Histogram represents the relative accumulation of ROS in the images. Error bars indicate SD from three technical replicates. Asterisks indicate significant differences (* p < 0.05, ** p < 0.01); (B) Left: Aniline blue staining for callose deposition in the leaves (40× magnification) expressing EV (empty vector), PsNLP and six selected genes. Numbers are the means and standard deviations of three 1 cm2 microscopic fields of view. Right: Histogram represents the means of three 1 cm2 microscopic fields of view. Error bars indicate SD. Asterisks indicate significant differences (** p < 0.01).

