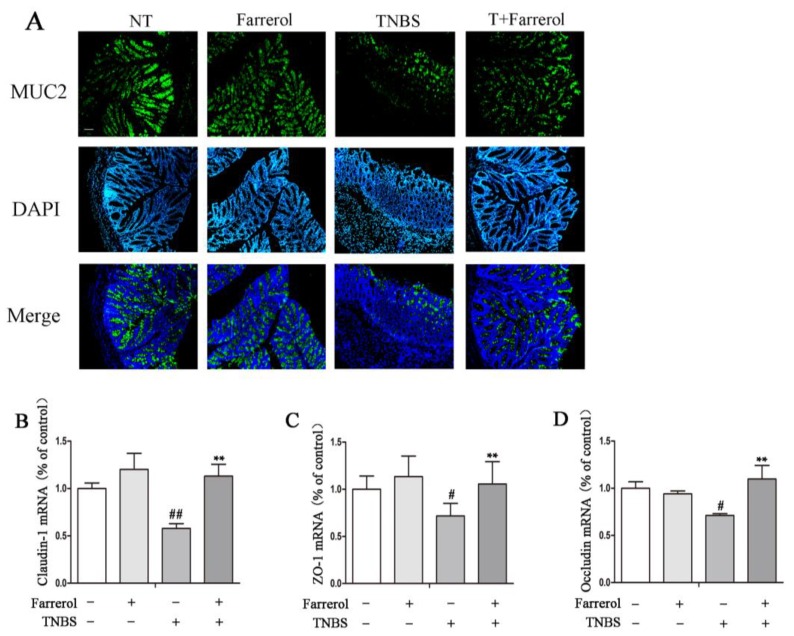
Figure 3.
Farrerol maintains mucin-2 (MUC2) expression and proper tight junctions in TNBS-induced mice. (A) Colonic MUC2 immunofluorescence staining. The MUC2 was observed by epifluorescence microscope. Green represented MUC2, and Blue represented DAPI. The magnification is 10×, and the scale bar represents is 100 μm. The gene expression of tight junction proteins including claudin-1 (B), ZO-1 (C), and Occludin (D) in the colonic tissue. n = 10, # p < 0.05 and ## p < 0.01 compared to the control group, ** p < 0.01 compared to the TNBS treatment group, and statistical significance was determined by ANOVA.

