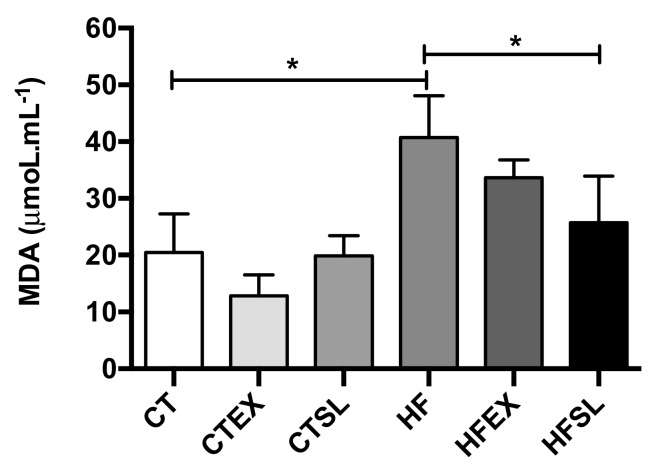
Figure 5.
Hepatic MDA concentrations (μmoL·mL−1) at the end of the experiment (n = 5 animals per group). CT: control group; CTEX: control group supplemented with beet stalks and leaves ethanolic extract; CTSL: control group supplemented with dehydrated beet stalks and leaves; HF: high-fat diet; HFEX: high-fat diet supplemented with beet stalks and leaves ethanolic extract; HFSL: high-fat diet supplemented with stalks and dried beet leaves. * Statistically significant difference (p < 0.05).

