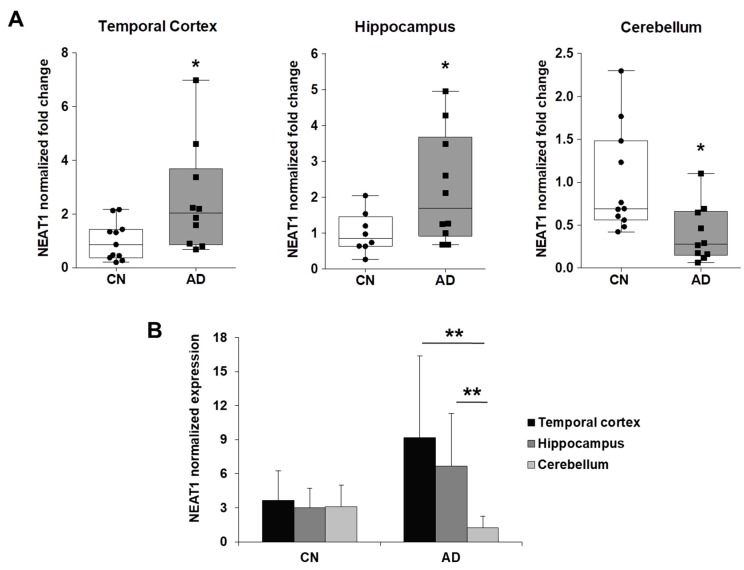
Figure 4.
Comparison between the levels of NEAT1 expression in AD and control brain tissues. (A) Dot-Box-plots of the levels of NEAT1 expression in three different brain areas (temporal cortex, hippocampus, and cerebellum) of AD patients (n = 10) and controls (n = 8–11). Dark horizontal lines represent the median, with the box representing the 25th and 75th percentiles, the whiskers the 5th and 95th percentiles. The average of control values was set to 1 and all values were calculated relatively. NEAT1 levels are significantly upregulated in temporal cortex and hippocampus and downregulated in cerebellum of AD patients, compared to control individuals. (B) Higher NEAT1 expression levels were observed in temporal cortex and hippocampus, compared to cerebellum, in AD patients, but not in control individuals. * p < 0.05, ** p < 0.01, Student’s t-test.

