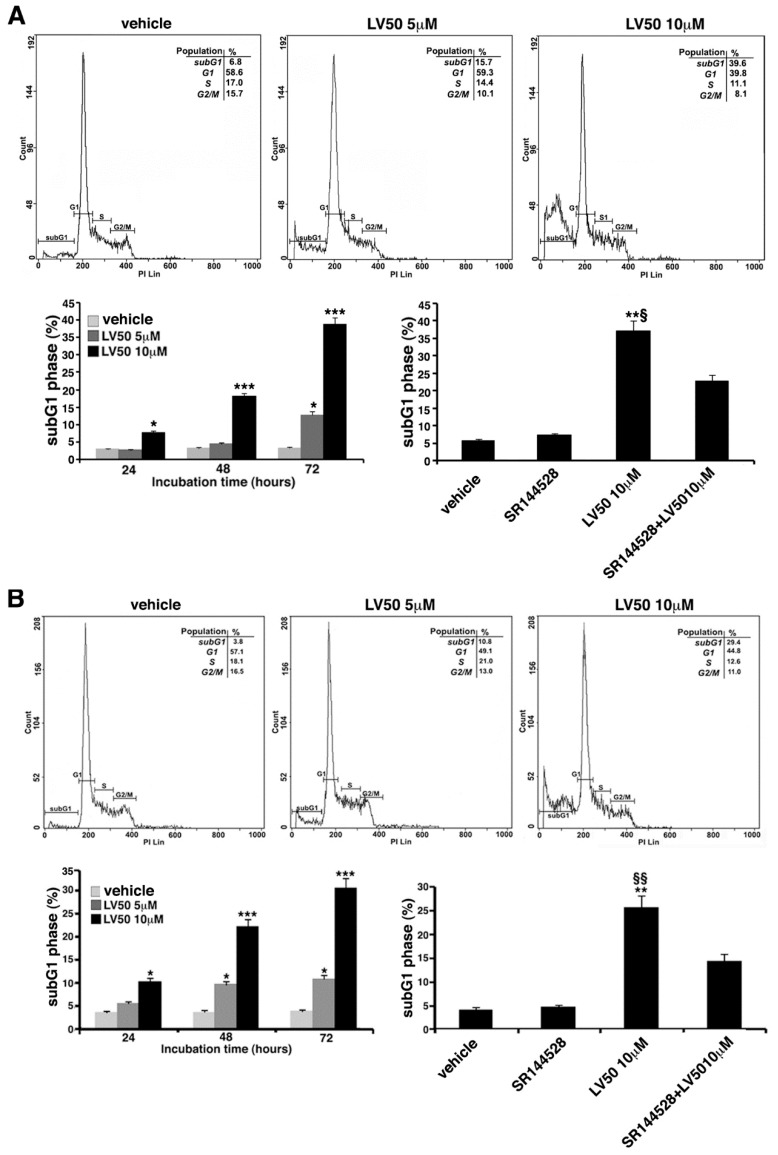
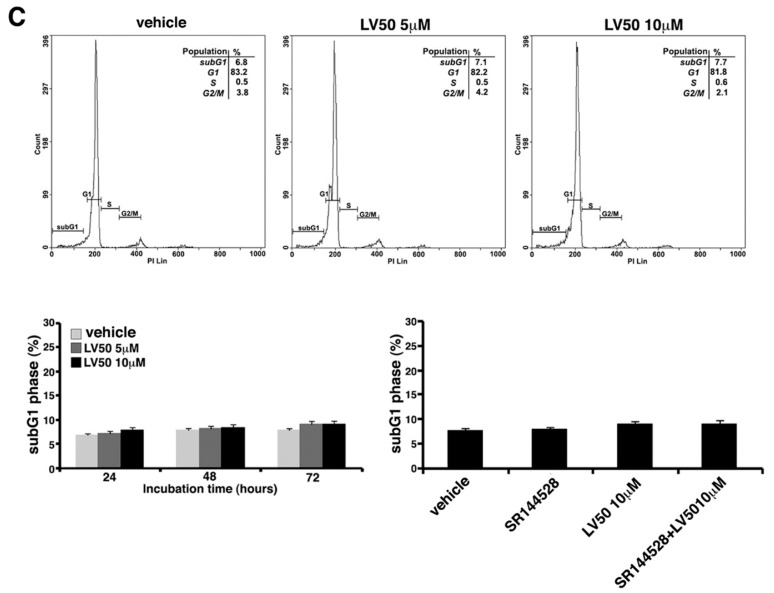
Figure 3.
Effect of LV50 on nuclear fragmentation. Jurkat, CEM, and PBL cells incubated with 5 μM or 10 μM LV50 for 72 h were analyzed by flow cytometric analysis after staining with propidium iodide. Histograms show cell cycle profiles and hypodiploid sub-G1 peak indicates typical DNA fragmentation that defines apoptosis. The percentage of cells in each phase of cell cycle is summarized below the histograms. Vehicle-treated or cells incubated with 5 μM or 10 μM LV50 were analyzed at three incubation times (24, 48, and 72 h). (A, left panel) Jurkat cells, results represent mean ± SD of three independent experiments. Statistical analysis indicated: * p < 0.05 versus vehicle; *** p < 0.001 versus vehicle. (A, right panel) In Jurkat cells, Propidium Iodide staining was performed in the presence or absence of the selective CB2R antagonist (1 μM). The results represent mean ± SD of three independent experiments. Statistical analysis indicated: ** p < 0.01 versus vehicle; § p < 0.05 versus pretreated with SR144528. (B, left panel) CEM cell, results represent mean ± SD of three independent experiments. Statistical analysis indicated: * p < 0.05 versus vehicle; *** p < 0.001 versus vehicle. (B, right panel) In CEM cells, propidium iodide staining was performed in the presence or absence of the selective CB2R antagonist (1 μM). The results represent mean ± SD of three independent experiments. Statistical analysis indicated: ** p < 0.01 versus vehicle; §§ p < 0.01 versus pretreated with SR144528. (C) PBL cells, results represent mean ± SD of three independent experiments. Statistical analysis indicated: LV50 10 μM versus vehicle NS (not significant).


