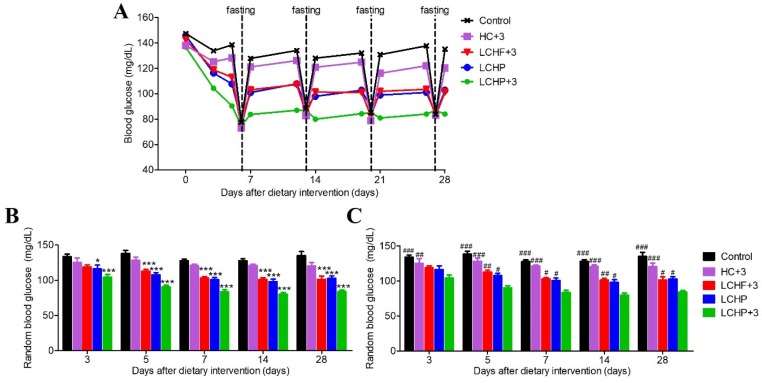
Figure 1.
Effects of various experimental diets on blood glucose levels. The five study diets used include a high-carbohydrate/low-omega-3 (Control) diet, a high-carbohydrate/high-omega-3 (HC+3) diet, a low-carbohydrate/high-fat/high-omega-3 (LCHF+3) diet, a low-carbohydrate/high-protein/low-omega-3 (LCHP) diet, and a low-carbohydrate/high-protein/high-omega-3 (LCHP+3) diet (see Tables S1 and S2 for details). (A) Random and fasting blood glucose levels at various time points during the feeding duration; (B) Representative statistical data for random blood glucose measurements; values are shown as mean ± SEM. Compared with the Control group, * p < 0.05, *** p < 0.001; (C) Representative statistical data for random blood glucose measurements; values are shown as mean ± SEM. Compared with the LCHP+3 group, # p < 0.05, ## p < 0.01, ### p < 0.001. n = 8 per group.

