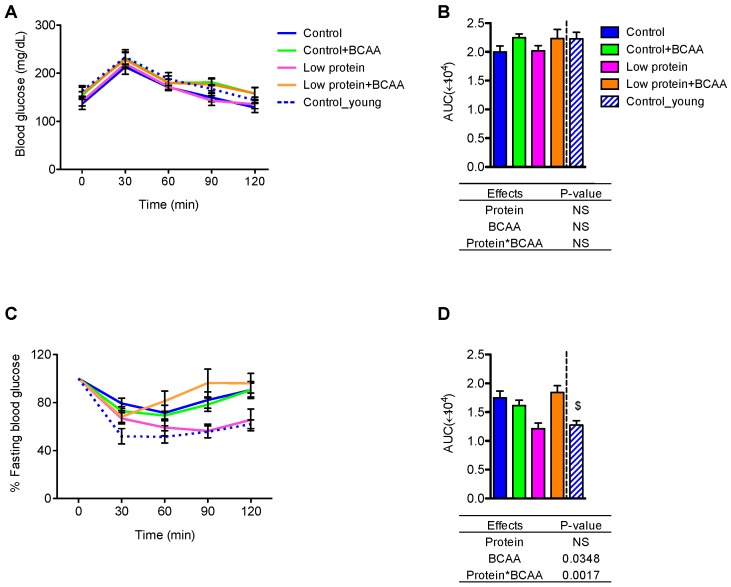
Figure 2.
The low protein diet improved insulin tolerance but did not affect glucose tolerance. Blood glucose across time (A) and area under the curve (AUC) (B) were recorded calculated from the GTT. The response to insulin as a percentage of fasting blood glucose was calculated for the ITT time course (C) and the corresponding AUC (D). Data represent mean ± SEM (n = 8–12 mice/group). Statistical analyses of main effects (protein and BCAA) and interactions (protein*BCAA) are shown below panels (B,D). $ p < 0.05 between the young and the old control groups by Student’s t test. GTT: glucose tolerance test; ITT: Insulin tolerance test.

