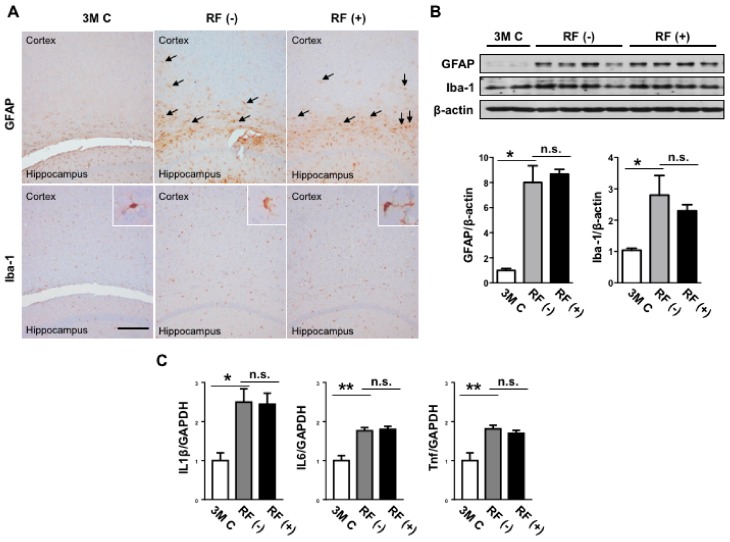
Figure 5.
Effects of RF-EMF exposure on the protein expression levels of GFAP and Iba-1 in the aged mouse brain. (A) Representative images of astrocytes expressing glial fibrillary acidic protein (GFAP, upper panel) and microglia expressing Iba-1 (lower panel) in the mouse brain following RF-EMF exposure. Black arrow shows increased expression of GFAP in the cortex area. Inserts show microglia from the cortex. Scale bar: 200 μm. (B) Western blot images of GFAP and Iba-1 following RF-EMF exposure. The graphs show the quantification of GFAP and Iba-1 protein levels in the young-aged (3M C), sham-exposed (RF (−)), and RF-exposed (RF (+)) mouse brain based on band intensity. (C) Changes in the levels of mRNAs encoding IL-1β, IL-6, TNF in the mouse brain. The values are presented as means ± SEM. * p < 0.05 and ** p < 0.01 versus young-aged (3M C) group. n.s.: no significance.

