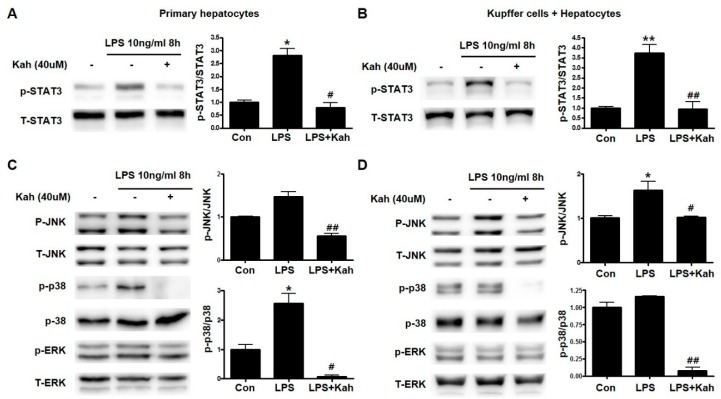
Figure 5.
Effect of kahweol on lipopolysaccharide (LPS)-induced activation of the STAT3 and MAPK signaling pathways. (A,B) Primary hepatocytes (A) and co-culture of primary Kupffer cells with hepatocytes (B) were pretreated with kahweol (Kah) and were pretreated with kahweol and then stimulated with or without LPS. The expression of phospho (p)-STAT3 was analyzed by western blot. Data represented in the bar graph are the mean ± SEM of three independent measurements. * p < 0.05, ** p < 0.01 compared with control (Con), # p < 0.05, ## p < 0.01 compared with LPS. T-STAT3, total STAT3 (C,D) Primary hepatocytes (C) and co-culture of primary Kupffer cells with hepatocytes (D) were pretreated with kahweol and then stimulated with or without LPS. The expression of p-JNK, p-p38, and p-ERK were analyzed by western blot. Data represented in the bar graph are the mean ± SEM of three independent measurements. * p < 0.05 compared with control (Con), # p< 0.05, ## p < 0.01 compared with LPS. T- JNK, total JNK. T-ERK, total ERK.

