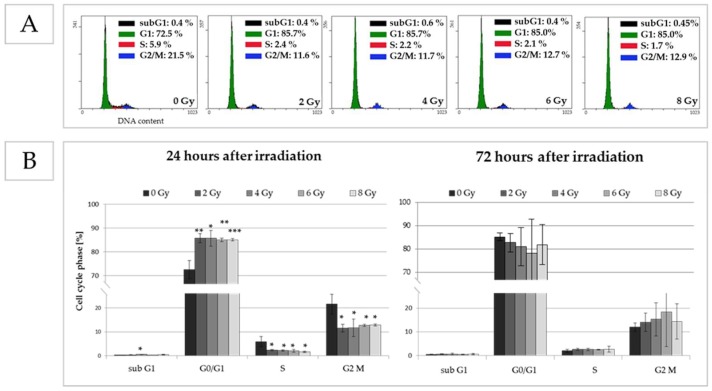
Figure 4.
Effect of irradiation on cell cycle progression after an incubation time of 24 and 72 h. Distribution of cells in cell cycle phases (G0/G1, S and G2/M) and cells with degraded cell DNA (subG1) was determined by flow cytometry using propidium iodide (PI) to measure the DNA content of each cell. (A) Exemplary histograms of cell cycle assay by flow cytometry of unirradiated (0 Gy) and irradiated pADSCs (0.25, 1, 2, 4, and 6 Gy), 24 h after the irradiation procedure; on the right corner of each image, results are illustrated as mean ± standard deviation (SD, n = 3); (B) Graphical illustration of cell cycle distribution of unirradiated and irradiated cells; asterisks illustrate significant differences to unirradiated cells (control): * p < 0.05; ** p < 0.01; *** p < 0.001 (students t-test and two-way ANOVA with Bonferroni post-hoc test).

