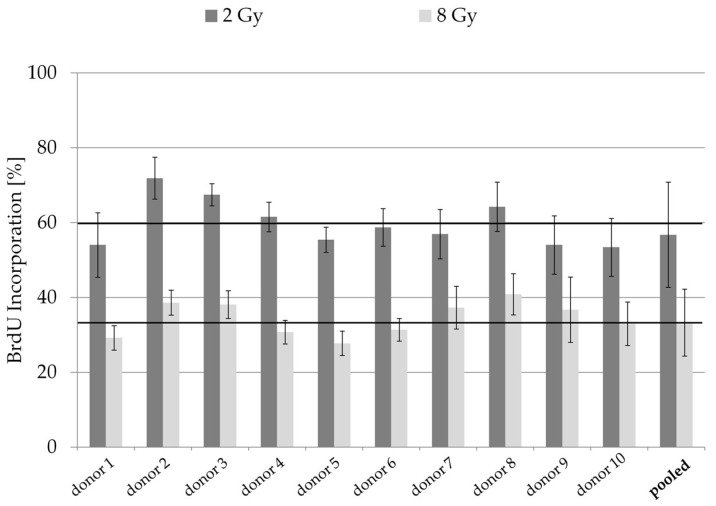
Figure A2.
Donor-specific differences in the proliferation rate of irradiated ADSCs: comparison of pooled cells and pooled data of ten different donors. Cell proliferation was measured using a BrdU ELISA colorimetric assay. Black lines illustrate the mean value of all individual donors. Results are illustrated as mean ± standard deviation (SD, n = 3).

