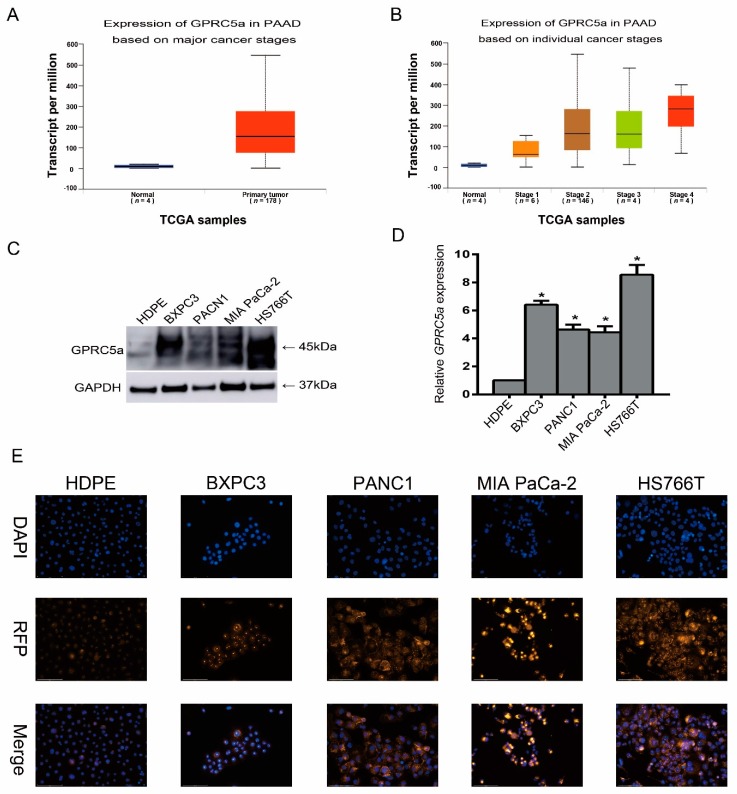
Figure 2.
GPRC5a expression levels in normal pancreas and PaCa (PAAD) tissue and cell lines. (A,B) The data-mining analysis showed that GPRC5a was significantly upregulated in PaCa (PAAD) samples with an association of increased expression in higher malignant tumor stages (p < 0.05). (C,D) The Western blot and qPCR results showed that the basic protein-level expression of GPRC5a in PaCa cell lines was higher than that in the HPDEE6E7 pancreas cell line. (E) Immunofluorescence assay showed upregulated expression of GPRC5a in PaCa cell lines (200×). The error bars were from multiple samples (n) measurement results (A,B) or three experimental measurements (C,D). * p-value < 0.05.

