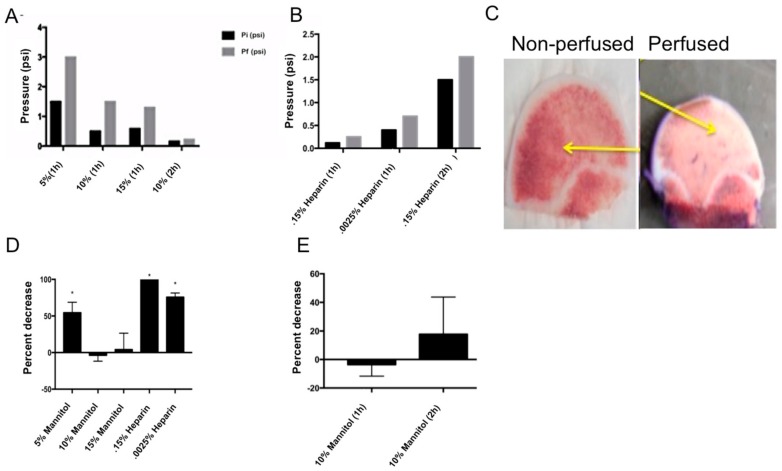
Figure 3.
Optimizing perfusion conditions: (A) Pre-soaked bovine femoral heads with varying concentrations of mannitol in DMEM. Initial pressure (Pi) and final pressure (Pf) readings were recorded. The two-hour, 10% mannitol soak showed consistent physiological pressure. (B) Pre-soaking bovine femoral heads with varying concentrations of heparin in DMEM. Again, initial pressure (Pi) and final pressure (Pf) readings were recorded. The one-hour soak in 1500U (0.15%) and 2500U (0.0025%) of heparin showed consistent physiological pressure readings. (C) Testing perfusion versus diffusion using 1% concentration of Villanueva stain in 1X PBS with a heparin presoak. The first image shows a non-perfused bovine femoral head, while the second image is a perfused bovine femoral head. The yellow arrows indicate the intact vasculature through which the Villanueva stain was present in the perfused bone, verse the vasculature that was not stained in the non-perfused bone. (D) C2C12 cell viability test with varying concentrations of mannitol or heparin, one hour after treatment. Both concentrations of mannitol (10% and 15%) showed no significant decrease in the percentage of viable cells (p < 0.05). The 0.15% heparin treatment resulted in a significant increase in cell death after one hour. (E) C2C12 cell viability test with 10% mannitol after one and two hours. There was no significant decrease in viable cells after either time point.

