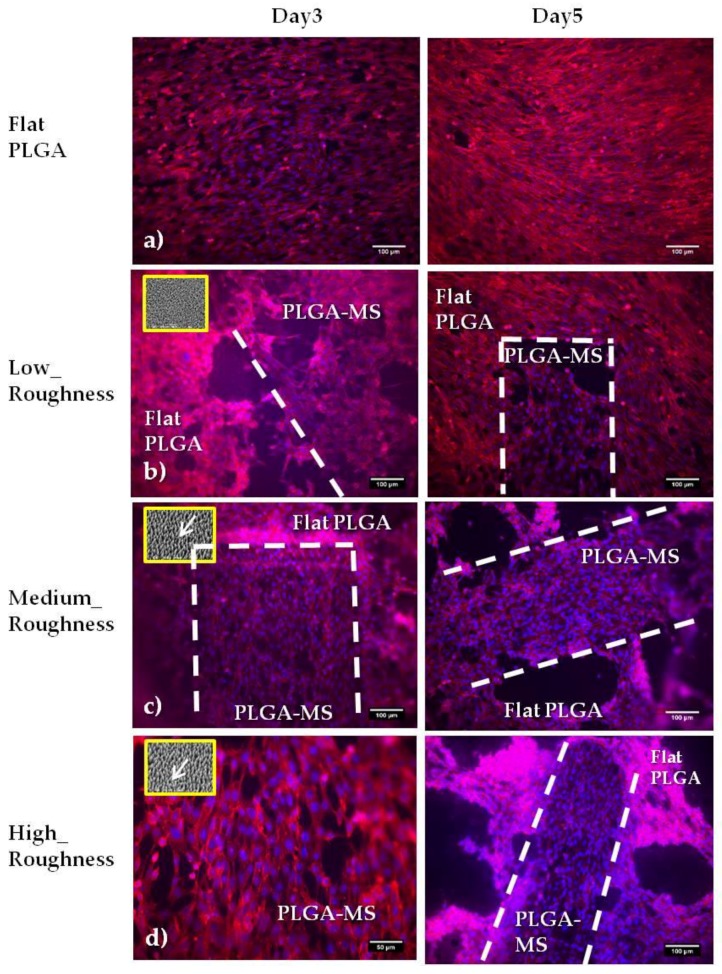
Figure 8.
Fluorescent images of Schwann cells cultured on the (a) flat PLGA and PLGA-MS replicas (b–d) for 3 and 5 days. Each replica is defined by low (b), medium (c), and high (d) roughness. The cytoskeleton of the cells is visualized with red color (Alexa Fluor® 568 Phalloidin). The white interrupted lines represent the PLGA-MS area, and thus the area with the spikes. It should be noted that for this specific study using the actin/DAPI assay, the PLGA-MS replicas (spike’s area) were 0.3–0.5 mm (width) and 1.5 mm (length). The inset SEM images on the left side, indicated by the yellow box, show the topography of the PLGA-MS replicas, and the white arrows represent the directionality of the spikes.

