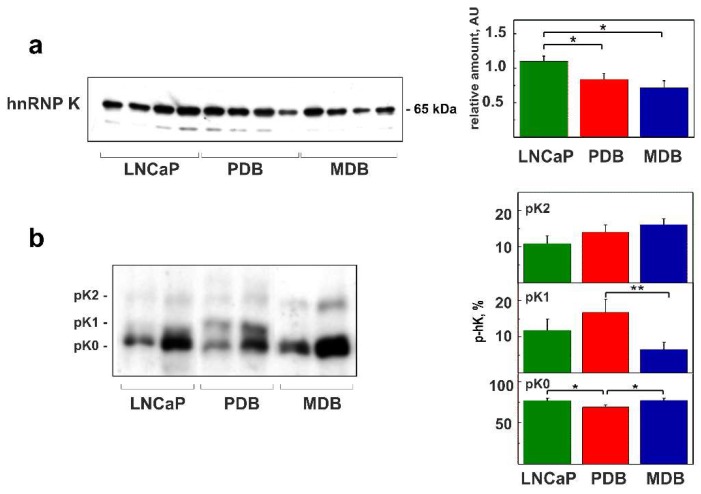
Figure 2.
HnRNP K decreased expression and altered phosphorylation in resistant cell lines PDB and MDB compared with LNCaP. (a) WB analysis of hnRNP K expression in total extracts from LNCaP, PDB, and MDB cell lines. The histogram on the right side represents the mean ± SE of relative amount of proteins determined in six WBs. (b) The quantitative analysis of hnRNP K phosphorylation was carried out using 1D Phos-tag and WB analysis of LNCaP, PDB, and MDB total extracts. The histograms on the right side represent the mean percentage ± SE of phosphorylated hnRNP K (p-hK) evaluated in four experiments. The hnRNP K isoforms with minimal (phK0), intermediate (phK1), or maximal (phK2) phosphorylation are indicated; * p < 0.05 and ** p < 0.01 (Student’s t-test).

