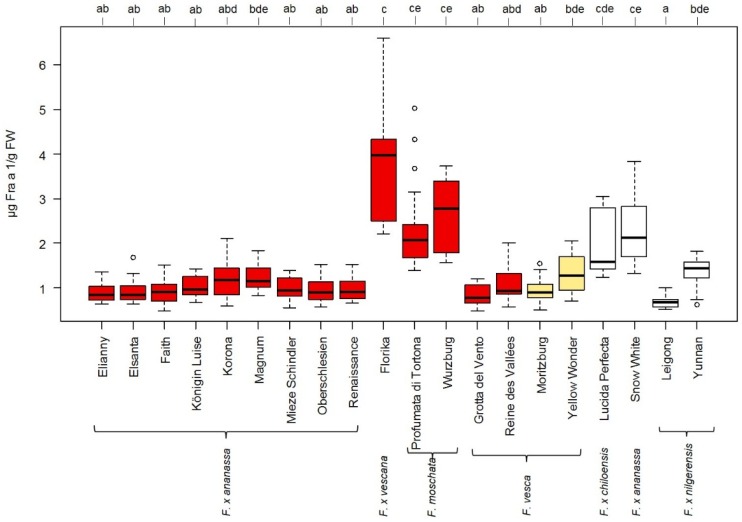
Figure 2.
Fra a 1 content in fruits of different strawberry genotypes. Allergen content in µg Fra a 1/g FW determined with indirect competitive ELISA. The color of the box plots corresponds to the color of the ripe strawberry fruits. Comparisons of median values were performed by the Dunn’s Test. Significant differences for each cultivar were calculated at a significance level of 5% (p value ≤ 0.05) indicated with letters a–d.

