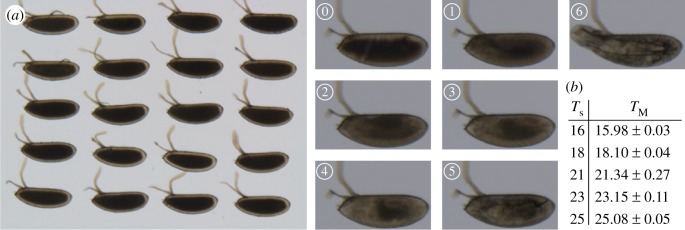
Figure 1.
Experimental set-up. (a) Left: Image of 20 D. melanogaster embryos in the microscope set-up. Right: Highlighting the different landmarks used in the paper to analyse temporal development, see also Material and methods and table 1. (b) Measured temperatures compared with the temperature set and corresponding standard deviation.

