Figure 3.
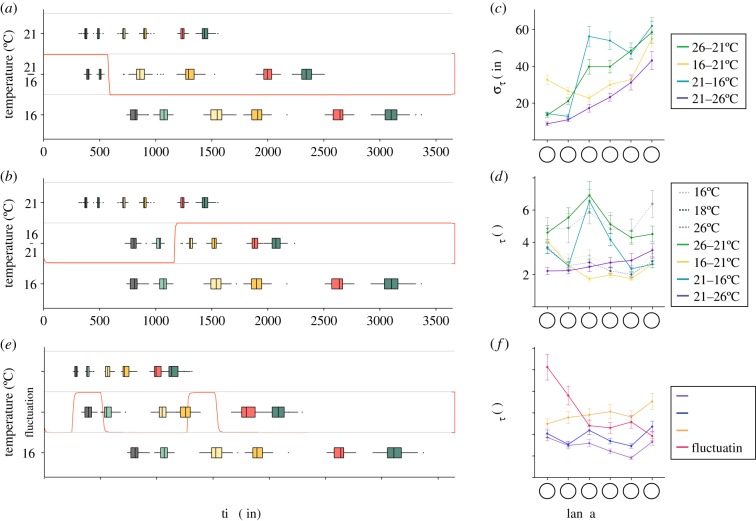
Drosophila melanogaster embryonic development under thermal perturbations. (a,b) Distribution of developmental times at each landmark scored for D. melanogaster under 16°C to/from 21°C temperature shift. Temperature was shifted after head involution and is represented by a red curve. Colour coding as in figure 1a. (c) Absolute error in developmental time at each landmark for D. melanogaster in 16°C to/from 21°C and 21°C to/from 26°C temperature shift experiments. (d) Relative error in developmental time at each landmark for D. melanogaster in 16°C to/from 21°C and 21°C to/from 26°C temperature shift experiments. (e) Distribution of developmental times at each landmark scored for D. melanogaster in temperature pulse experiments. Temperature was shifted at regular interval and is represented by a red curve. Colour coding as in figure 1a. (f) Relative error in developmental time at each landmark for D. melanogaster in pulse experiments. All error bars are standard deviation, which in (d,f) are estimated by bootstrapping.

