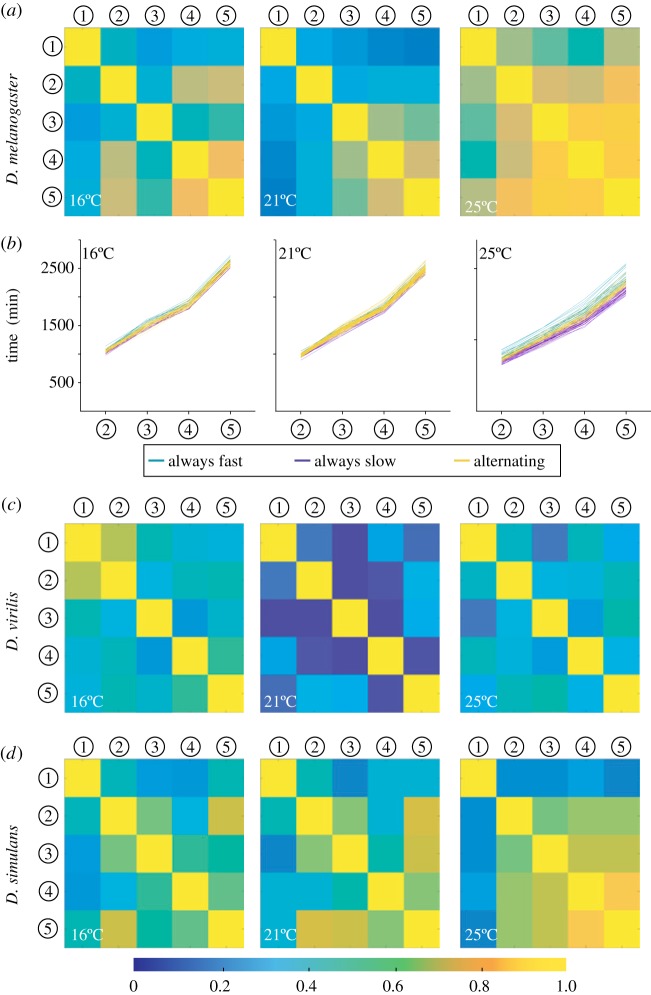
Figure 4.
Temporal trajectories are history dependent. (a) Covariance between each landmark for D. melanogaster at 16, 21 and 25°C. (b) Individual embryo time courses at 16, 21 and 26°C colour coded by whether an embryo's development is always faster than the mean at that temperature (turquoise), always slower than the mean at that temperature (purple), or whether the trajectory alternates at least once between being faster or slower than the mean (yellow). (c,d) Covariance between each landmark at 16, 21 and 25°C for D. virilis (c) and D. simulans (d).

