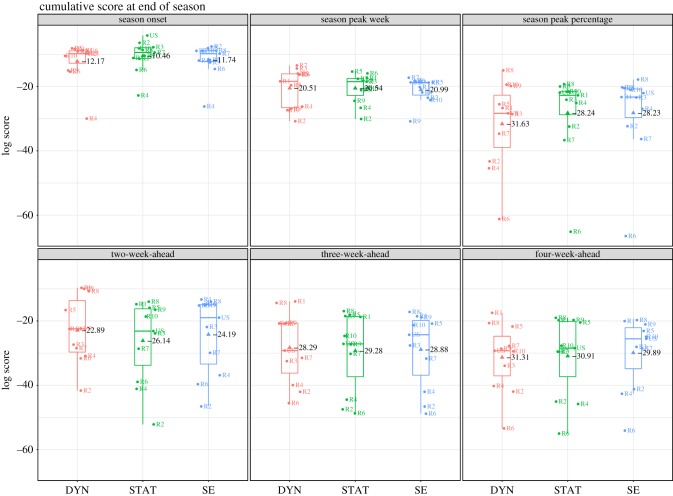
Figure 2.
Cumulative score at the end of season by location and target. Target ‘one-week-ahead’ was excluded as it would be identical for the three methods. The boxplot denotes the median, interquartile range (IQR) and the extrema (IQR*1.5). The text in black shows the mean score across the 11 locations.

